Lebanese vs Immigrants from Sudan Unemployment Among Women with Children Under 18 years
COMPARE
Lebanese
Immigrants from Sudan
Unemployment Among Women with Children Under 18 years
Unemployment Among Women with Children Under 18 years Comparison
Lebanese
Immigrants from Sudan
5.4%
UNEMPLOYMENT AMONG WOMEN WITH CHILDREN UNDER 18 YEARS
64.7/ 100
METRIC RATING
163rd/ 347
METRIC RANK
5.5%
UNEMPLOYMENT AMONG WOMEN WITH CHILDREN UNDER 18 YEARS
40.6/ 100
METRIC RATING
182nd/ 347
METRIC RANK
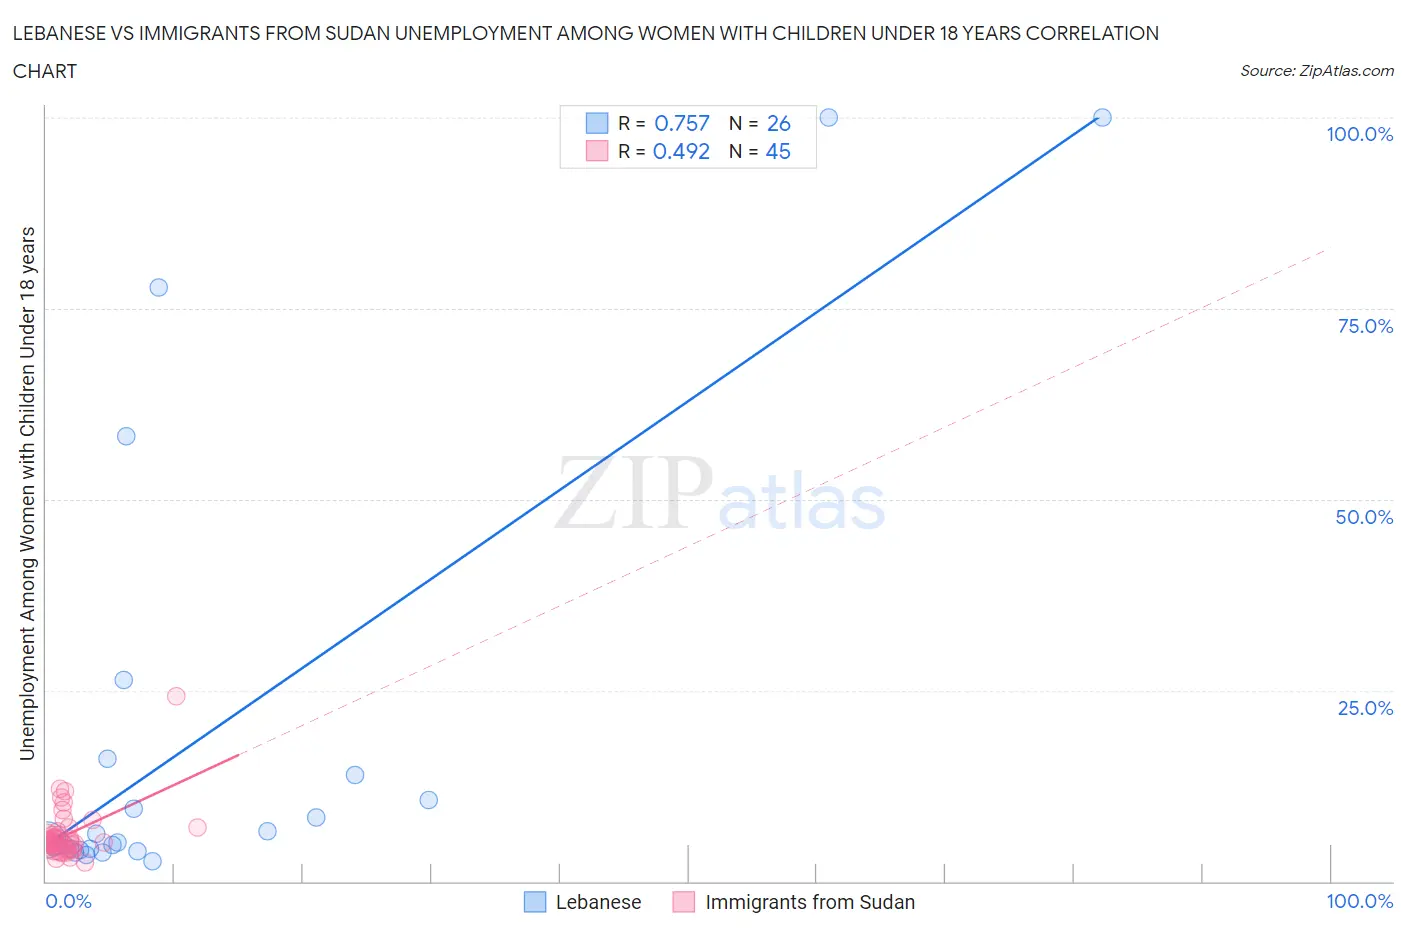
Lebanese vs Immigrants from Sudan Unemployment Among Women with Children Under 18 years Correlation Chart
The statistical analysis conducted on geographies consisting of 384,417,368 people shows a strong positive correlation between the proportion of Lebanese and unemployment rate among women with children under the age of 18 in the United States with a correlation coefficient (R) of 0.757 and weighted average of 5.4%. Similarly, the statistical analysis conducted on geographies consisting of 117,921,145 people shows a moderate positive correlation between the proportion of Immigrants from Sudan and unemployment rate among women with children under the age of 18 in the United States with a correlation coefficient (R) of 0.492 and weighted average of 5.5%, a difference of 1.8%.
Unemployment Among Women with Children Under 18 years Correlation Summary
| Measurement | Lebanese | Immigrants from Sudan |
| Minimum | 2.7% | 2.4% |
| Maximum | 100.0% | 24.3% |
| Range | 97.3% | 21.9% |
| Mean | 19.0% | 6.1% |
| Median | 5.2% | 5.2% |
| Interquartile 25% (IQ1) | 4.2% | 4.3% |
| Interquartile 75% (IQ3) | 13.9% | 6.4% |
| Interquartile Range (IQR) | 9.7% | 2.1% |
| Standard Deviation (Sample) | 29.6% | 3.5% |
| Standard Deviation (Population) | 29.0% | 3.5% |
Demographics Similar to Lebanese and Immigrants from Sudan by Unemployment Among Women with Children Under 18 years
In terms of unemployment among women with children under 18 years, the demographic groups most similar to Lebanese are Immigrants from Saudi Arabia (5.4%, a difference of 0.030%), Celtic (5.4%, a difference of 0.13%), Tlingit-Haida (5.4%, a difference of 0.22%), Aleut (5.4%, a difference of 0.41%), and Immigrants from Denmark (5.4%, a difference of 0.51%). Similarly, the demographic groups most similar to Immigrants from Sudan are Immigrants from Hungary (5.5%, a difference of 0.060%), Immigrants from Southern Europe (5.5%, a difference of 0.15%), Syrian (5.5%, a difference of 0.16%), Costa Rican (5.5%, a difference of 0.33%), and Hawaiian (5.5%, a difference of 0.40%).
| Demographics | Rating | Rank | Unemployment Among Women with Children Under 18 years |
| Immigrants | Saudi Arabia | 65.0 /100 | #162 | Good 5.4% |
| Lebanese | 64.7 /100 | #163 | Good 5.4% |
| Celtics | 63.0 /100 | #164 | Good 5.4% |
| Tlingit-Haida | 61.9 /100 | #165 | Good 5.4% |
| Aleuts | 59.4 /100 | #166 | Average 5.4% |
| Immigrants | Denmark | 58.0 /100 | #167 | Average 5.4% |
| Immigrants | Northern Africa | 56.1 /100 | #168 | Average 5.4% |
| Immigrants | Thailand | 55.3 /100 | #169 | Average 5.4% |
| Samoans | 54.1 /100 | #170 | Average 5.4% |
| Immigrants | Philippines | 53.1 /100 | #171 | Average 5.4% |
| Immigrants | Kazakhstan | 51.7 /100 | #172 | Average 5.4% |
| Immigrants | Eastern Africa | 51.3 /100 | #173 | Average 5.4% |
| Immigrants | Uzbekistan | 50.0 /100 | #174 | Average 5.4% |
| Spanish | 49.0 /100 | #175 | Average 5.4% |
| Immigrants | Germany | 48.5 /100 | #176 | Average 5.5% |
| Hawaiians | 46.1 /100 | #177 | Average 5.5% |
| Costa Ricans | 45.2 /100 | #178 | Average 5.5% |
| Syrians | 42.8 /100 | #179 | Average 5.5% |
| Immigrants | Southern Europe | 42.7 /100 | #180 | Average 5.5% |
| Immigrants | Hungary | 41.3 /100 | #181 | Average 5.5% |
| Immigrants | Sudan | 40.6 /100 | #182 | Average 5.5% |