Lebanese vs Tongan Disability Age 35 to 64
COMPARE
Lebanese
Tongan
Disability Age 35 to 64
Disability Age 35 to 64 Comparison
Lebanese
Tongans
11.3%
DISABILITY AGE 35 TO 64
51.8/ 100
METRIC RATING
173rd/ 347
METRIC RANK
10.5%
DISABILITY AGE 35 TO 64
96.6/ 100
METRIC RATING
113th/ 347
METRIC RANK
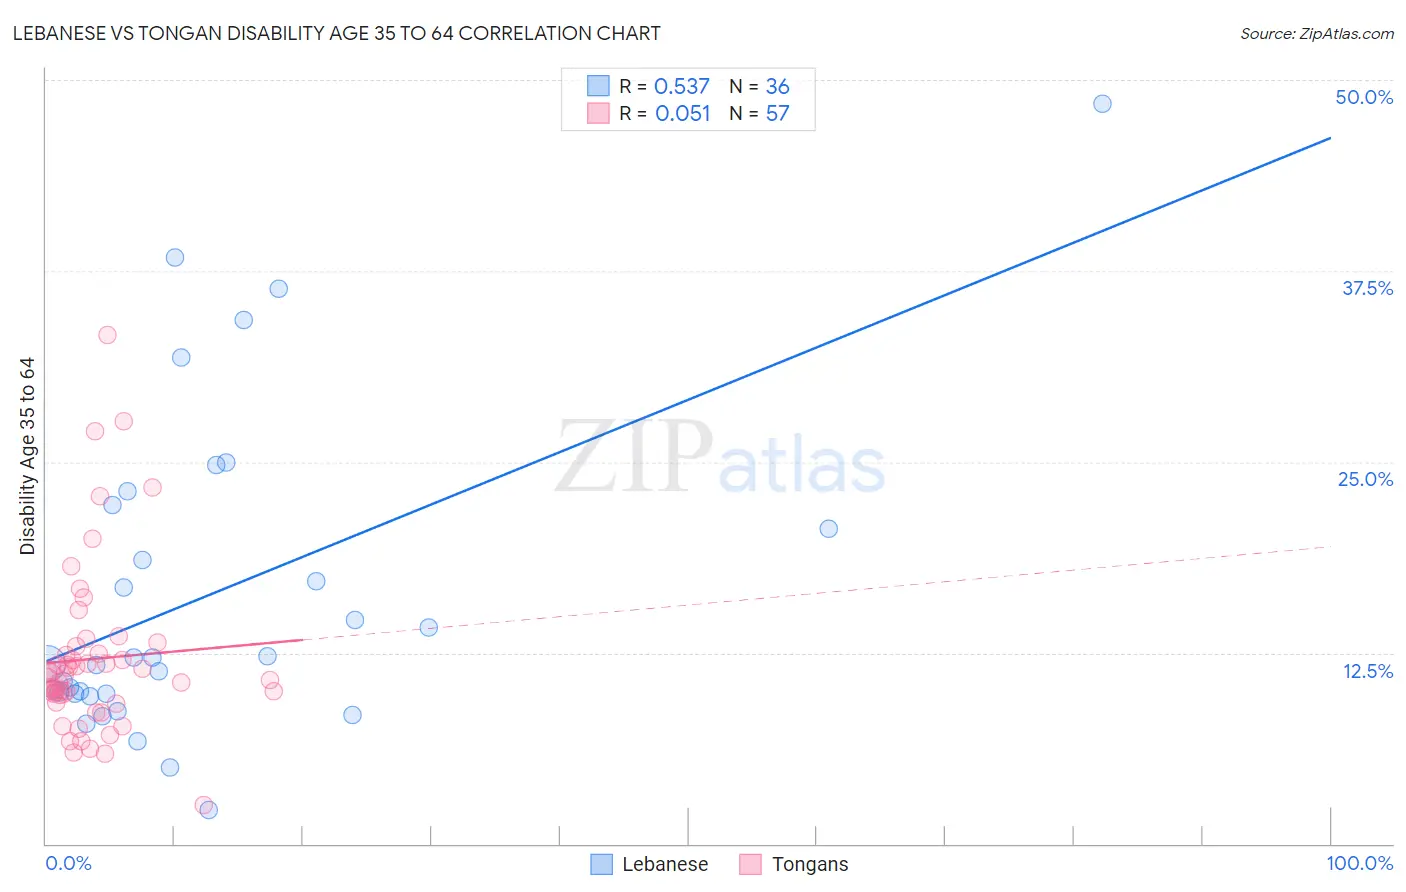
Lebanese vs Tongan Disability Age 35 to 64 Correlation Chart
The statistical analysis conducted on geographies consisting of 401,283,534 people shows a substantial positive correlation between the proportion of Lebanese and percentage of population with a disability between the ages 34 and 64 in the United States with a correlation coefficient (R) of 0.537 and weighted average of 11.3%. Similarly, the statistical analysis conducted on geographies consisting of 102,864,945 people shows a slight positive correlation between the proportion of Tongans and percentage of population with a disability between the ages 34 and 64 in the United States with a correlation coefficient (R) of 0.051 and weighted average of 10.5%, a difference of 7.1%.
Disability Age 35 to 64 Correlation Summary
| Measurement | Lebanese | Tongan |
| Minimum | 2.2% | 2.5% |
| Maximum | 48.5% | 33.3% |
| Range | 46.2% | 30.8% |
| Mean | 16.3% | 12.1% |
| Median | 12.0% | 10.9% |
| Interquartile 25% (IQ1) | 9.8% | 9.5% |
| Interquartile 75% (IQ3) | 21.4% | 12.7% |
| Interquartile Range (IQR) | 11.6% | 3.2% |
| Standard Deviation (Sample) | 10.5% | 5.6% |
| Standard Deviation (Population) | 10.4% | 5.5% |
Similar Demographics by Disability Age 35 to 64
Demographics Similar to Lebanese by Disability Age 35 to 64
In terms of disability age 35 to 64, the demographic groups most similar to Lebanese are Immigrants from Fiji (11.3%, a difference of 0.14%), Italian (11.2%, a difference of 0.31%), Czech (11.3%, a difference of 0.31%), Immigrants from Trinidad and Tobago (11.2%, a difference of 0.34%), and Immigrants from Uganda (11.2%, a difference of 0.51%).
| Demographics | Rating | Rank | Disability Age 35 to 64 |
| Immigrants | Haiti | 63.8 /100 | #166 | Good 11.1% |
| Austrians | 63.2 /100 | #167 | Good 11.1% |
| Central Americans | 59.1 /100 | #168 | Average 11.2% |
| Haitians | 59.0 /100 | #169 | Average 11.2% |
| Immigrants | Uganda | 58.0 /100 | #170 | Average 11.2% |
| Immigrants | Trinidad and Tobago | 55.9 /100 | #171 | Average 11.2% |
| Italians | 55.6 /100 | #172 | Average 11.2% |
| Lebanese | 51.8 /100 | #173 | Average 11.3% |
| Immigrants | Fiji | 50.0 /100 | #174 | Average 11.3% |
| Czechs | 47.9 /100 | #175 | Average 11.3% |
| Ugandans | 43.7 /100 | #176 | Average 11.3% |
| Immigrants | Eastern Africa | 42.2 /100 | #177 | Average 11.3% |
| Poles | 42.0 /100 | #178 | Average 11.3% |
| Immigrants | Barbados | 41.6 /100 | #179 | Average 11.3% |
| Immigrants | Caribbean | 41.5 /100 | #180 | Average 11.3% |
Demographics Similar to Tongans by Disability Age 35 to 64
In terms of disability age 35 to 64, the demographic groups most similar to Tongans are Immigrants from Morocco (10.5%, a difference of 0.050%), Assyrian/Chaldean/Syriac (10.5%, a difference of 0.12%), Brazilian (10.5%, a difference of 0.15%), Immigrants from Netherlands (10.5%, a difference of 0.21%), and Korean (10.5%, a difference of 0.36%).
| Demographics | Rating | Rank | Disability Age 35 to 64 |
| Immigrants | Hungary | 97.6 /100 | #106 | Exceptional 10.4% |
| Zimbabweans | 97.4 /100 | #107 | Exceptional 10.4% |
| Ethiopians | 97.4 /100 | #108 | Exceptional 10.5% |
| Immigrants | Ethiopia | 97.2 /100 | #109 | Exceptional 10.5% |
| Koreans | 97.1 /100 | #110 | Exceptional 10.5% |
| Brazilians | 96.9 /100 | #111 | Exceptional 10.5% |
| Assyrians/Chaldeans/Syriacs | 96.8 /100 | #112 | Exceptional 10.5% |
| Tongans | 96.6 /100 | #113 | Exceptional 10.5% |
| Immigrants | Morocco | 96.6 /100 | #114 | Exceptional 10.5% |
| Immigrants | Netherlands | 96.3 /100 | #115 | Exceptional 10.5% |
| Immigrants | Nepal | 95.9 /100 | #116 | Exceptional 10.6% |
| Immigrants | South Eastern Asia | 95.7 /100 | #117 | Exceptional 10.6% |
| Immigrants | Moldova | 95.5 /100 | #118 | Exceptional 10.6% |
| Luxembourgers | 95.5 /100 | #119 | Exceptional 10.6% |
| Vietnamese | 95.4 /100 | #120 | Exceptional 10.6% |