Latvian vs Yup'ik Disability Age 35 to 64
COMPARE
Latvian
Yup'ik
Disability Age 35 to 64
Disability Age 35 to 64 Comparison
Latvians
Yup'ik
10.2%
DISABILITY AGE 35 TO 64
99.2/ 100
METRIC RATING
81st/ 347
METRIC RANK
16.9%
DISABILITY AGE 35 TO 64
0.0/ 100
METRIC RATING
344th/ 347
METRIC RANK
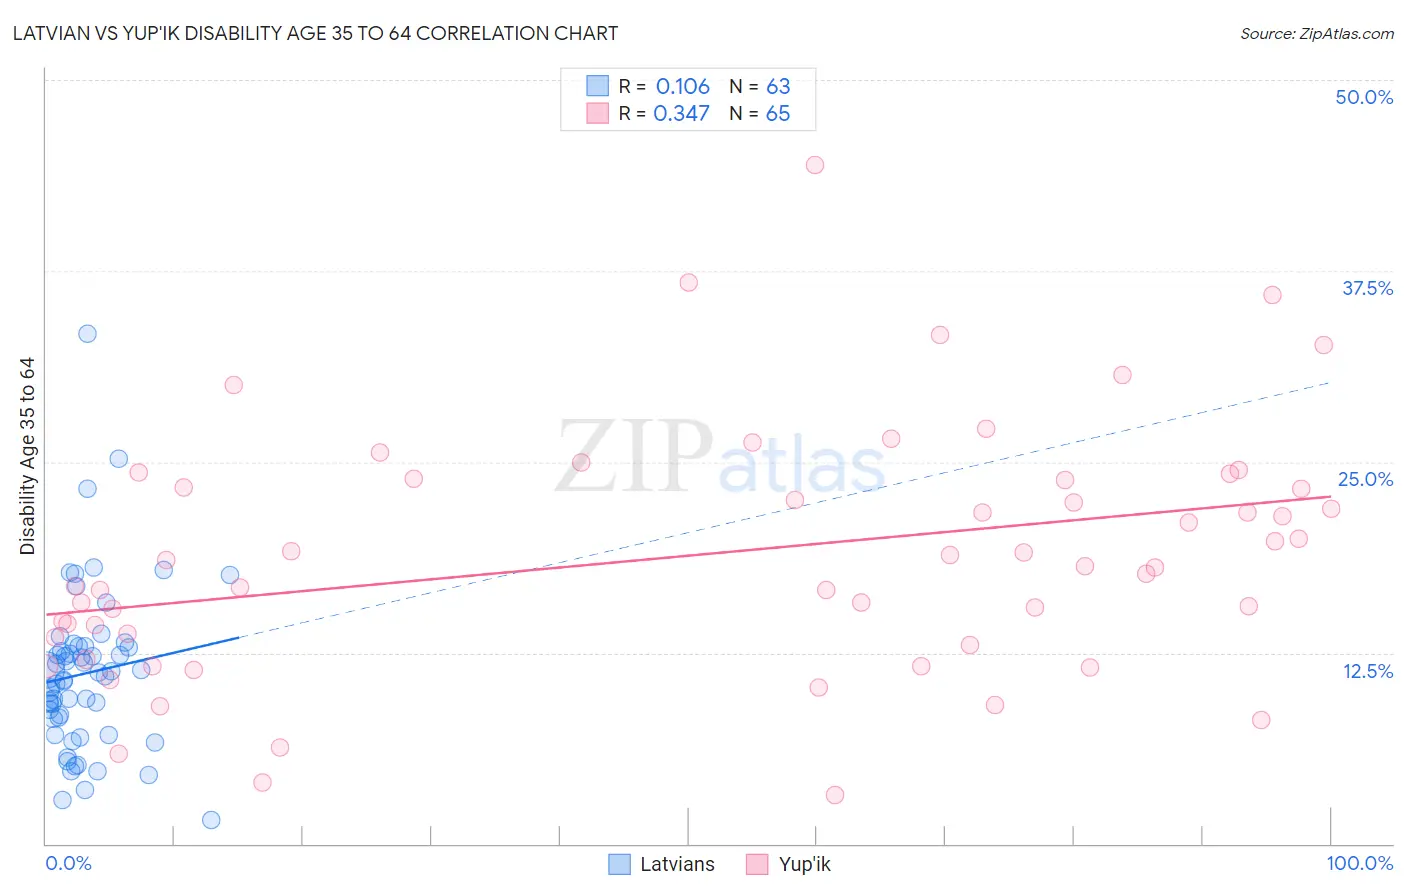
Latvian vs Yup'ik Disability Age 35 to 64 Correlation Chart
The statistical analysis conducted on geographies consisting of 220,634,735 people shows a poor positive correlation between the proportion of Latvians and percentage of population with a disability between the ages 34 and 64 in the United States with a correlation coefficient (R) of 0.106 and weighted average of 10.2%. Similarly, the statistical analysis conducted on geographies consisting of 39,958,174 people shows a mild positive correlation between the proportion of Yup'ik and percentage of population with a disability between the ages 34 and 64 in the United States with a correlation coefficient (R) of 0.347 and weighted average of 16.9%, a difference of 66.6%.
Disability Age 35 to 64 Correlation Summary
| Measurement | Latvian | Yup'ik |
| Minimum | 1.5% | 3.2% |
| Maximum | 33.4% | 44.4% |
| Range | 31.8% | 41.2% |
| Mean | 11.2% | 18.9% |
| Median | 10.9% | 18.2% |
| Interquartile 25% (IQ1) | 8.2% | 13.2% |
| Interquartile 75% (IQ3) | 12.9% | 23.9% |
| Interquartile Range (IQR) | 4.7% | 10.6% |
| Standard Deviation (Sample) | 5.4% | 8.1% |
| Standard Deviation (Population) | 5.3% | 8.1% |
Similar Demographics by Disability Age 35 to 64
Demographics Similar to Latvians by Disability Age 35 to 64
In terms of disability age 35 to 64, the demographic groups most similar to Latvians are Russian (10.2%, a difference of 0.060%), Immigrants from Brazil (10.2%, a difference of 0.070%), Immigrants from Croatia (10.2%, a difference of 0.10%), Sri Lankan (10.2%, a difference of 0.13%), and Immigrants from Vietnam (10.1%, a difference of 0.23%).
| Demographics | Rating | Rank | Disability Age 35 to 64 |
| Laotians | 99.4 /100 | #74 | Exceptional 10.1% |
| Immigrants | Latvia | 99.4 /100 | #75 | Exceptional 10.1% |
| Immigrants | Chile | 99.4 /100 | #76 | Exceptional 10.1% |
| Mongolians | 99.4 /100 | #77 | Exceptional 10.1% |
| Jordanians | 99.3 /100 | #78 | Exceptional 10.1% |
| Immigrants | Vietnam | 99.3 /100 | #79 | Exceptional 10.1% |
| Immigrants | Croatia | 99.3 /100 | #80 | Exceptional 10.2% |
| Latvians | 99.2 /100 | #81 | Exceptional 10.2% |
| Russians | 99.2 /100 | #82 | Exceptional 10.2% |
| Immigrants | Brazil | 99.2 /100 | #83 | Exceptional 10.2% |
| Sri Lankans | 99.2 /100 | #84 | Exceptional 10.2% |
| Immigrants | Kuwait | 99.1 /100 | #85 | Exceptional 10.2% |
| Immigrants | Europe | 99.1 /100 | #86 | Exceptional 10.2% |
| Nicaraguans | 99.1 /100 | #87 | Exceptional 10.2% |
| Chileans | 99.0 /100 | #88 | Exceptional 10.2% |
Demographics Similar to Yup'ik by Disability Age 35 to 64
In terms of disability age 35 to 64, the demographic groups most similar to Yup'ik are Creek (16.9%, a difference of 0.32%), Tohono O'odham (16.7%, a difference of 1.2%), Tsimshian (16.7%, a difference of 1.3%), Kiowa (17.4%, a difference of 2.5%), and Choctaw (16.4%, a difference of 3.2%).
| Demographics | Rating | Rank | Disability Age 35 to 64 |
| Yuman | 0.0 /100 | #333 | Tragic 15.8% |
| Colville | 0.0 /100 | #334 | Tragic 15.8% |
| Seminole | 0.0 /100 | #335 | Tragic 15.9% |
| Menominee | 0.0 /100 | #336 | Tragic 15.9% |
| Puerto Ricans | 0.0 /100 | #337 | Tragic 15.9% |
| Chickasaw | 0.0 /100 | #338 | Tragic 16.1% |
| Pima | 0.0 /100 | #339 | Tragic 16.1% |
| Choctaw | 0.0 /100 | #340 | Tragic 16.4% |
| Tsimshian | 0.0 /100 | #341 | Tragic 16.7% |
| Tohono O'odham | 0.0 /100 | #342 | Tragic 16.7% |
| Creek | 0.0 /100 | #343 | Tragic 16.9% |
| Yup'ik | 0.0 /100 | #344 | Tragic 16.9% |
| Kiowa | 0.0 /100 | #345 | Tragic 17.4% |
| Lumbee | 0.0 /100 | #346 | Tragic 17.6% |
| Houma | 0.0 /100 | #347 | Tragic 18.7% |