Korean vs Immigrants from Eastern Europe Disability Age Over 75
COMPARE
Korean
Immigrants from Eastern Europe
Disability Age Over 75
Disability Age Over 75 Comparison
Koreans
Immigrants from Eastern Europe
48.6%
DISABILITY AGE OVER 75
0.8/ 100
METRIC RATING
251st/ 347
METRIC RANK
46.3%
DISABILITY AGE OVER 75
97.7/ 100
METRIC RATING
100th/ 347
METRIC RANK
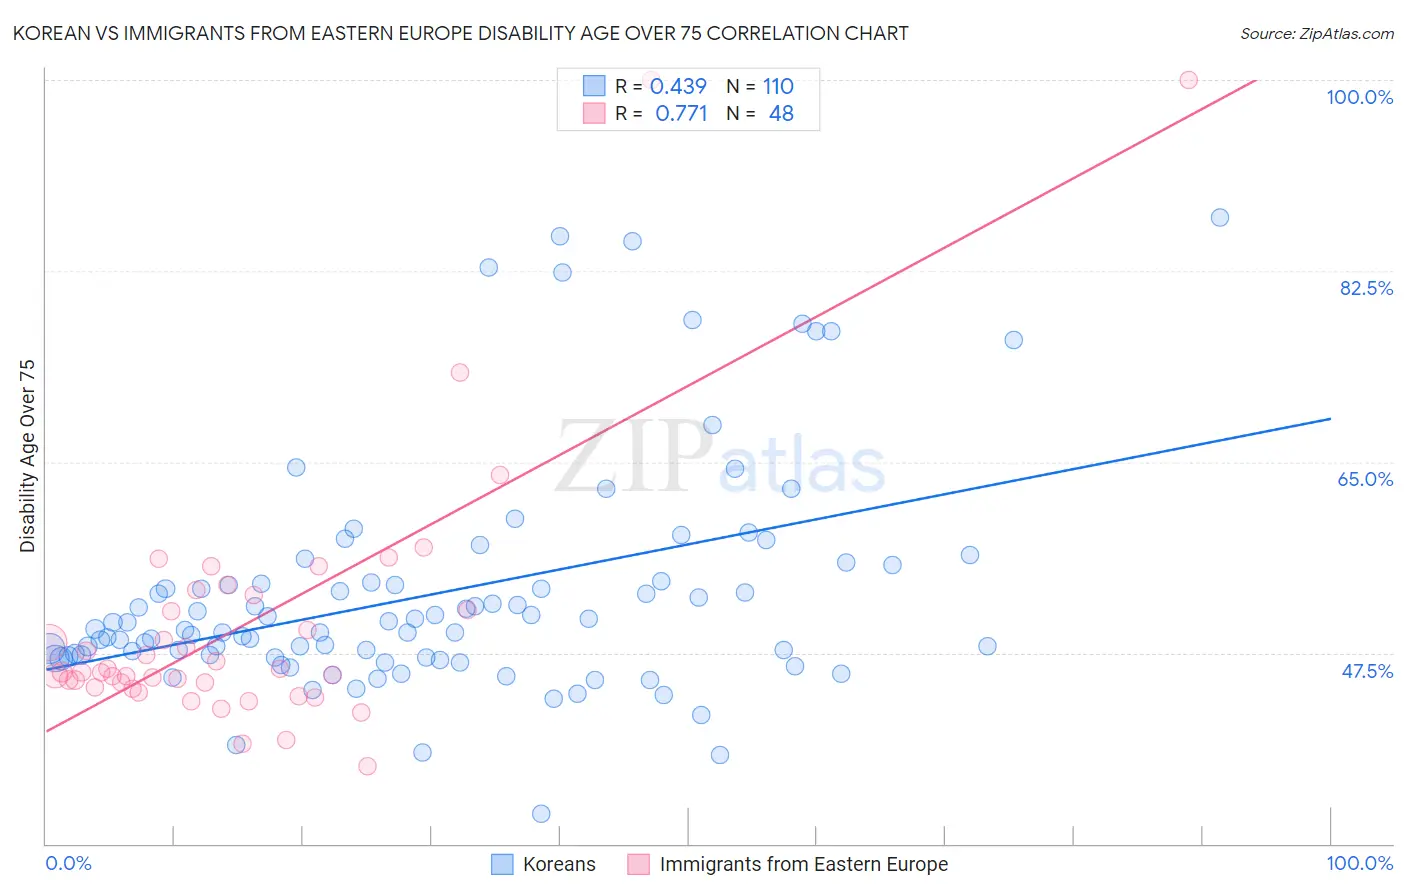
Korean vs Immigrants from Eastern Europe Disability Age Over 75 Correlation Chart
The statistical analysis conducted on geographies consisting of 509,359,043 people shows a moderate positive correlation between the proportion of Koreans and percentage of population with a disability over the age of 75 in the United States with a correlation coefficient (R) of 0.439 and weighted average of 48.6%. Similarly, the statistical analysis conducted on geographies consisting of 474,726,991 people shows a strong positive correlation between the proportion of Immigrants from Eastern Europe and percentage of population with a disability over the age of 75 in the United States with a correlation coefficient (R) of 0.771 and weighted average of 46.3%, a difference of 4.9%.
Disability Age Over 75 Correlation Summary
| Measurement | Korean | Immigrants from Eastern Europe |
| Minimum | 32.7% | 37.1% |
| Maximum | 87.4% | 100.0% |
| Range | 54.7% | 62.9% |
| Mean | 52.9% | 50.1% |
| Median | 49.6% | 45.7% |
| Interquartile 25% (IQ1) | 47.1% | 44.6% |
| Interquartile 75% (IQ3) | 53.9% | 52.1% |
| Interquartile Range (IQR) | 6.9% | 7.6% |
| Standard Deviation (Sample) | 10.5% | 12.3% |
| Standard Deviation (Population) | 10.4% | 12.2% |
Similar Demographics by Disability Age Over 75
Demographics Similar to Koreans by Disability Age Over 75
In terms of disability age over 75, the demographic groups most similar to Koreans are West Indian (48.6%, a difference of 0.020%), Iraqi (48.6%, a difference of 0.10%), Immigrants from South Eastern Asia (48.7%, a difference of 0.10%), British West Indian (48.7%, a difference of 0.15%), and Immigrants from Vietnam (48.7%, a difference of 0.18%).
| Demographics | Rating | Rank | Disability Age Over 75 |
| Afghans | 1.8 /100 | #244 | Tragic 48.4% |
| Americans | 1.7 /100 | #245 | Tragic 48.4% |
| Chippewa | 1.6 /100 | #246 | Tragic 48.4% |
| Iroquois | 1.6 /100 | #247 | Tragic 48.4% |
| Sri Lankans | 1.4 /100 | #248 | Tragic 48.5% |
| Iraqis | 1.0 /100 | #249 | Tragic 48.6% |
| West Indians | 0.8 /100 | #250 | Tragic 48.6% |
| Koreans | 0.8 /100 | #251 | Tragic 48.6% |
| Immigrants | South Eastern Asia | 0.7 /100 | #252 | Tragic 48.7% |
| British West Indians | 0.6 /100 | #253 | Tragic 48.7% |
| Immigrants | Vietnam | 0.6 /100 | #254 | Tragic 48.7% |
| Chinese | 0.5 /100 | #255 | Tragic 48.7% |
| Immigrants | Congo | 0.5 /100 | #256 | Tragic 48.7% |
| Blackfeet | 0.5 /100 | #257 | Tragic 48.8% |
| Immigrants | Philippines | 0.4 /100 | #258 | Tragic 48.8% |
Demographics Similar to Immigrants from Eastern Europe by Disability Age Over 75
In terms of disability age over 75, the demographic groups most similar to Immigrants from Eastern Europe are Palestinian (46.3%, a difference of 0.0%), Mongolian (46.3%, a difference of 0.0%), Immigrants from Japan (46.3%, a difference of 0.040%), Finnish (46.3%, a difference of 0.050%), and Immigrants from Brazil (46.3%, a difference of 0.080%).
| Demographics | Rating | Rank | Disability Age Over 75 |
| Ugandans | 98.2 /100 | #93 | Exceptional 46.3% |
| Albanians | 98.1 /100 | #94 | Exceptional 46.3% |
| Immigrants | Brazil | 98.0 /100 | #95 | Exceptional 46.3% |
| Immigrants | China | 98.0 /100 | #96 | Exceptional 46.3% |
| Finns | 97.9 /100 | #97 | Exceptional 46.3% |
| Immigrants | Japan | 97.8 /100 | #98 | Exceptional 46.3% |
| Palestinians | 97.7 /100 | #99 | Exceptional 46.3% |
| Immigrants | Eastern Europe | 97.7 /100 | #100 | Exceptional 46.3% |
| Mongolians | 97.7 /100 | #101 | Exceptional 46.3% |
| Immigrants | Malaysia | 97.1 /100 | #102 | Exceptional 46.4% |
| Ukrainians | 97.1 /100 | #103 | Exceptional 46.4% |
| Israelis | 97.0 /100 | #104 | Exceptional 46.4% |
| Immigrants | Cameroon | 96.9 /100 | #105 | Exceptional 46.4% |
| Immigrants | Kuwait | 96.8 /100 | #106 | Exceptional 46.4% |
| Immigrants | Uruguay | 96.7 /100 | #107 | Exceptional 46.4% |