Jamaican vs Creek Disability Age 5 to 17
COMPARE
Jamaican
Creek
Disability Age 5 to 17
Disability Age 5 to 17 Comparison
Jamaicans
Creek
6.2%
DISABILITY AGE 5 TO 17
0.0/ 100
METRIC RATING
288th/ 347
METRIC RANK
6.9%
DISABILITY AGE 5 TO 17
0.0/ 100
METRIC RATING
337th/ 347
METRIC RANK
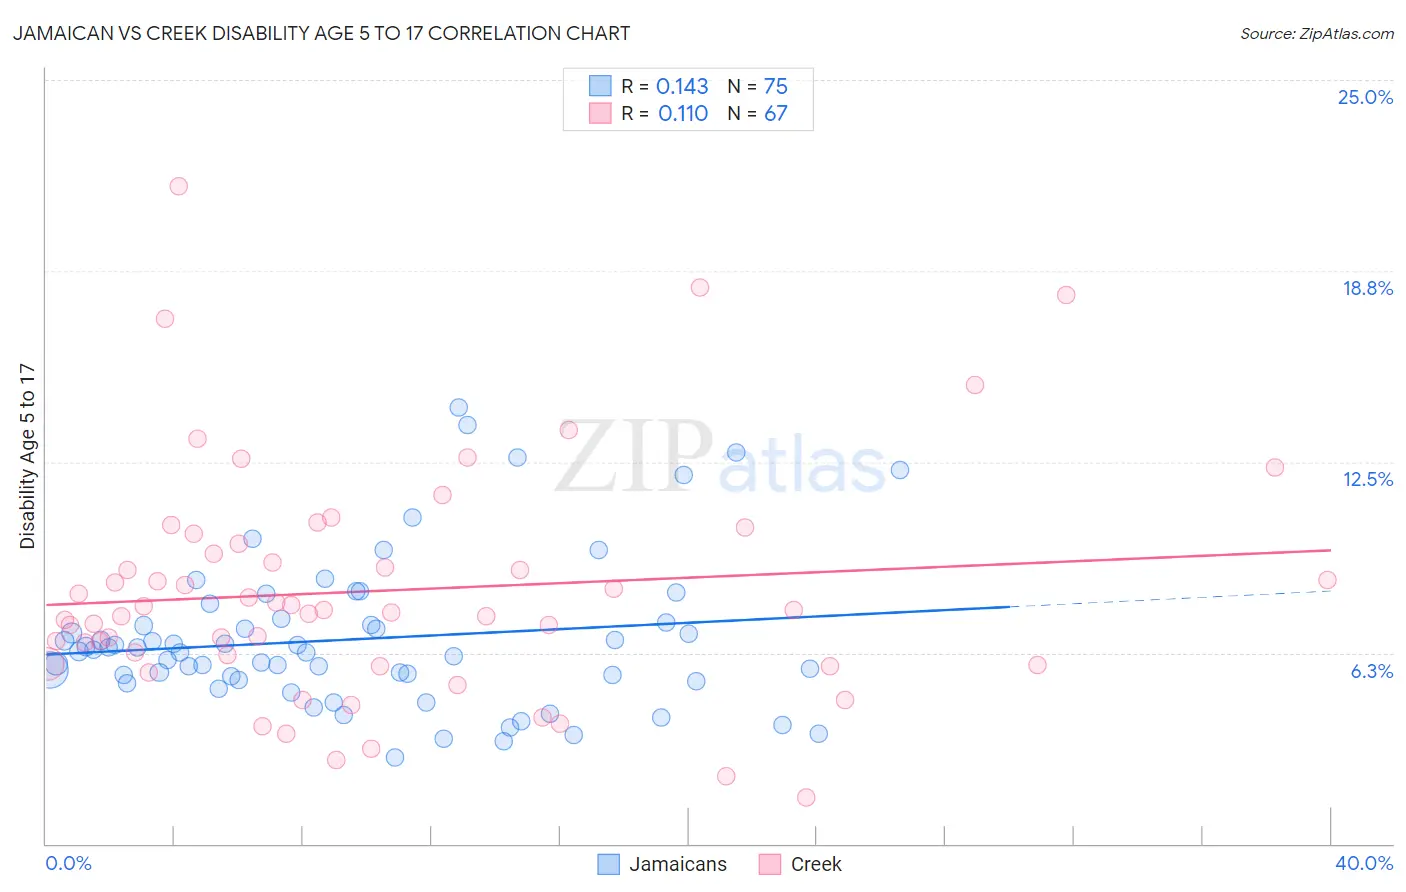
Jamaican vs Creek Disability Age 5 to 17 Correlation Chart
The statistical analysis conducted on geographies consisting of 365,362,529 people shows a poor positive correlation between the proportion of Jamaicans and percentage of population with a disability between the ages 5 and 17 in the United States with a correlation coefficient (R) of 0.143 and weighted average of 6.2%. Similarly, the statistical analysis conducted on geographies consisting of 177,779,638 people shows a poor positive correlation between the proportion of Creek and percentage of population with a disability between the ages 5 and 17 in the United States with a correlation coefficient (R) of 0.110 and weighted average of 6.9%, a difference of 11.0%.
Disability Age 5 to 17 Correlation Summary
| Measurement | Jamaican | Creek |
| Minimum | 2.8% | 1.5% |
| Maximum | 14.3% | 21.5% |
| Range | 11.5% | 20.0% |
| Mean | 6.7% | 8.3% |
| Median | 6.3% | 7.6% |
| Interquartile 25% (IQ1) | 5.4% | 5.9% |
| Interquartile 75% (IQ3) | 7.2% | 9.8% |
| Interquartile Range (IQR) | 1.8% | 4.0% |
| Standard Deviation (Sample) | 2.4% | 3.8% |
| Standard Deviation (Population) | 2.4% | 3.8% |
Similar Demographics by Disability Age 5 to 17
Demographics Similar to Jamaicans by Disability Age 5 to 17
In terms of disability age 5 to 17, the demographic groups most similar to Jamaicans are Yaqui (6.2%, a difference of 0.010%), Immigrants from Congo (6.2%, a difference of 0.010%), White/Caucasian (6.2%, a difference of 0.15%), Pima (6.2%, a difference of 0.26%), and Immigrants from Senegal (6.2%, a difference of 0.40%).
| Demographics | Rating | Rank | Disability Age 5 to 17 |
| Scottish | 0.0 /100 | #281 | Tragic 6.1% |
| Germans | 0.0 /100 | #282 | Tragic 6.1% |
| Ugandans | 0.0 /100 | #283 | Tragic 6.2% |
| Sub-Saharan Africans | 0.0 /100 | #284 | Tragic 6.2% |
| English | 0.0 /100 | #285 | Tragic 6.2% |
| Colville | 0.0 /100 | #286 | Tragic 6.2% |
| Pima | 0.0 /100 | #287 | Tragic 6.2% |
| Jamaicans | 0.0 /100 | #288 | Tragic 6.2% |
| Yaqui | 0.0 /100 | #289 | Tragic 6.2% |
| Immigrants | Congo | 0.0 /100 | #290 | Tragic 6.2% |
| Whites/Caucasians | 0.0 /100 | #291 | Tragic 6.2% |
| Immigrants | Senegal | 0.0 /100 | #292 | Tragic 6.2% |
| Central American Indians | 0.0 /100 | #293 | Tragic 6.2% |
| Irish | 0.0 /100 | #294 | Tragic 6.2% |
| Cree | 0.0 /100 | #295 | Tragic 6.2% |
Demographics Similar to Creek by Disability Age 5 to 17
In terms of disability age 5 to 17, the demographic groups most similar to Creek are Iroquois (6.9%, a difference of 0.24%), Chickasaw (6.8%, a difference of 0.43%), Choctaw (6.9%, a difference of 0.57%), Cherokee (6.9%, a difference of 0.83%), and Ottawa (6.8%, a difference of 0.93%).
| Demographics | Rating | Rank | Disability Age 5 to 17 |
| Dutch West Indians | 0.0 /100 | #330 | Tragic 6.7% |
| French Canadians | 0.0 /100 | #331 | Tragic 6.7% |
| Immigrants | Azores | 0.0 /100 | #332 | Tragic 6.7% |
| Blacks/African Americans | 0.0 /100 | #333 | Tragic 6.8% |
| Seminole | 0.0 /100 | #334 | Tragic 6.8% |
| Ottawa | 0.0 /100 | #335 | Tragic 6.8% |
| Chickasaw | 0.0 /100 | #336 | Tragic 6.8% |
| Creek | 0.0 /100 | #337 | Tragic 6.9% |
| Iroquois | 0.0 /100 | #338 | Tragic 6.9% |
| Choctaw | 0.0 /100 | #339 | Tragic 6.9% |
| Cherokee | 0.0 /100 | #340 | Tragic 6.9% |
| Cape Verdeans | 0.0 /100 | #341 | Tragic 7.0% |
| Chippewa | 0.0 /100 | #342 | Tragic 7.1% |
| Immigrants | Cabo Verde | 0.0 /100 | #343 | Tragic 7.1% |
| Cajuns | 0.0 /100 | #344 | Tragic 7.2% |