Italian vs Immigrants from West Indies Cognitive Disability
COMPARE
Italian
Immigrants from West Indies
Cognitive Disability
Cognitive Disability Comparison
Italians
Immigrants from West Indies
16.4%
COGNITIVE DISABILITY
99.9/ 100
METRIC RATING
33rd/ 347
METRIC RANK
18.1%
COGNITIVE DISABILITY
0.1/ 100
METRIC RATING
288th/ 347
METRIC RANK
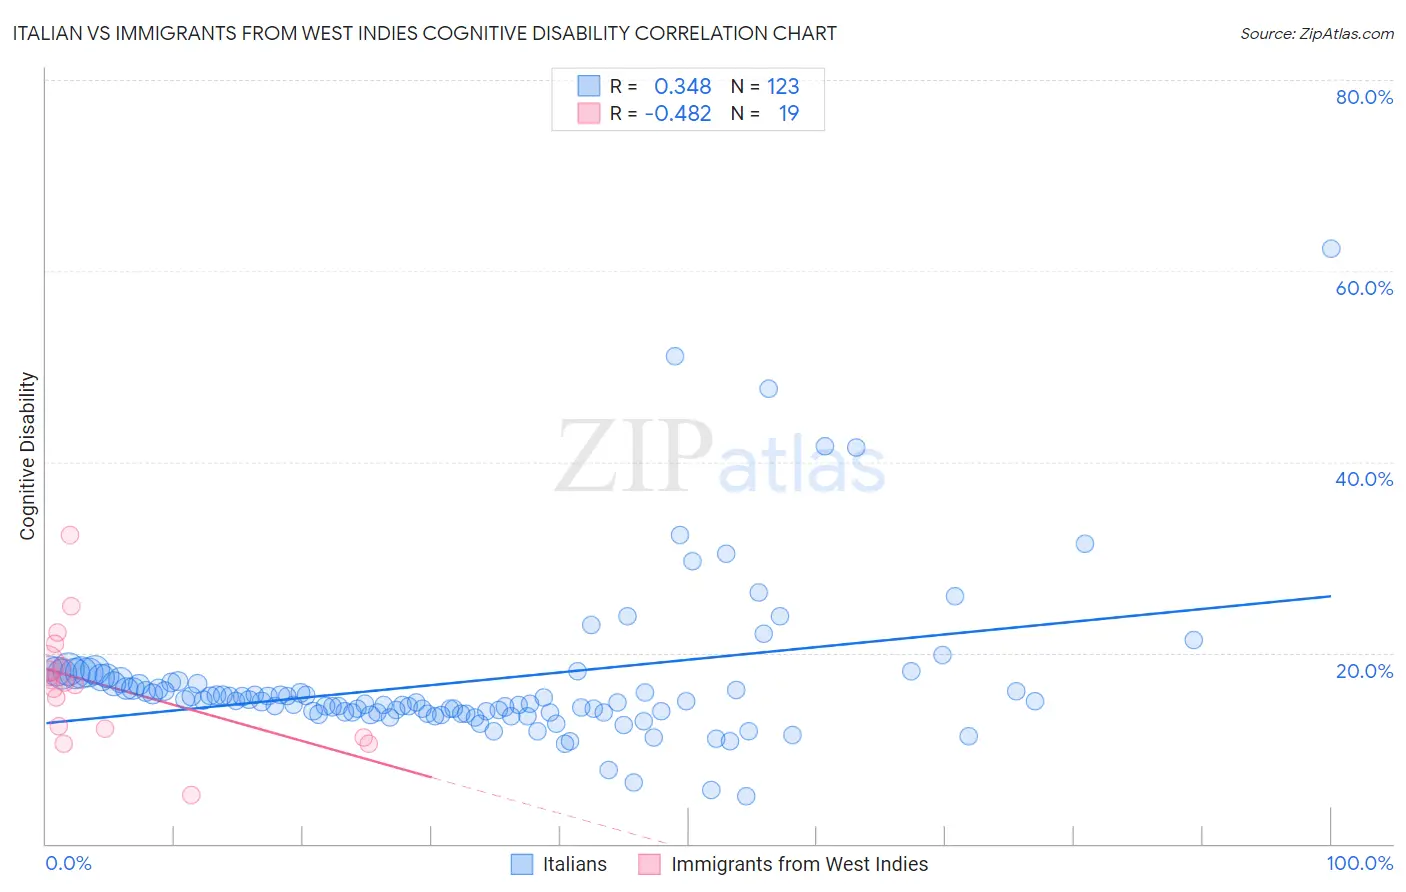
Italian vs Immigrants from West Indies Cognitive Disability Correlation Chart
The statistical analysis conducted on geographies consisting of 574,911,788 people shows a mild positive correlation between the proportion of Italians and percentage of population with cognitive disability in the United States with a correlation coefficient (R) of 0.348 and weighted average of 16.4%. Similarly, the statistical analysis conducted on geographies consisting of 72,456,461 people shows a moderate negative correlation between the proportion of Immigrants from West Indies and percentage of population with cognitive disability in the United States with a correlation coefficient (R) of -0.482 and weighted average of 18.1%, a difference of 10.5%.
Cognitive Disability Correlation Summary
| Measurement | Italian | Immigrants from West Indies |
| Minimum | 4.9% | 5.0% |
| Maximum | 62.3% | 32.4% |
| Range | 57.4% | 27.4% |
| Mean | 16.9% | 16.7% |
| Median | 15.0% | 16.9% |
| Interquartile 25% (IQ1) | 13.7% | 12.1% |
| Interquartile 75% (IQ3) | 17.1% | 18.8% |
| Interquartile Range (IQR) | 3.3% | 6.8% |
| Standard Deviation (Sample) | 8.0% | 6.0% |
| Standard Deviation (Population) | 8.0% | 5.9% |
Similar Demographics by Cognitive Disability
Demographics Similar to Italians by Cognitive Disability
In terms of cognitive disability, the demographic groups most similar to Italians are Russian (16.4%, a difference of 0.0%), Immigrants from Israel (16.4%, a difference of 0.070%), Slovak (16.4%, a difference of 0.080%), Greek (16.4%, a difference of 0.090%), and Immigrants from Romania (16.4%, a difference of 0.13%).
| Demographics | Rating | Rank | Cognitive Disability |
| Immigrants | Croatia | 99.9 /100 | #26 | Exceptional 16.4% |
| Immigrants | Pakistan | 99.9 /100 | #27 | Exceptional 16.4% |
| Poles | 99.9 /100 | #28 | Exceptional 16.4% |
| Filipinos | 99.9 /100 | #29 | Exceptional 16.4% |
| Czechs | 99.9 /100 | #30 | Exceptional 16.4% |
| Immigrants | Romania | 99.9 /100 | #31 | Exceptional 16.4% |
| Immigrants | Israel | 99.9 /100 | #32 | Exceptional 16.4% |
| Italians | 99.9 /100 | #33 | Exceptional 16.4% |
| Russians | 99.9 /100 | #34 | Exceptional 16.4% |
| Slovaks | 99.9 /100 | #35 | Exceptional 16.4% |
| Greeks | 99.9 /100 | #36 | Exceptional 16.4% |
| Slovenes | 99.9 /100 | #37 | Exceptional 16.5% |
| Immigrants | Eastern Europe | 99.9 /100 | #38 | Exceptional 16.5% |
| Bolivians | 99.9 /100 | #39 | Exceptional 16.5% |
| Immigrants | Belarus | 99.9 /100 | #40 | Exceptional 16.5% |
Demographics Similar to Immigrants from West Indies by Cognitive Disability
In terms of cognitive disability, the demographic groups most similar to Immigrants from West Indies are Dutch West Indian (18.1%, a difference of 0.010%), Native/Alaskan (18.1%, a difference of 0.010%), Immigrants from Africa (18.1%, a difference of 0.040%), Kenyan (18.1%, a difference of 0.050%), and Bermudan (18.1%, a difference of 0.090%).
| Demographics | Rating | Rank | Cognitive Disability |
| Yakama | 0.1 /100 | #281 | Tragic 18.1% |
| Immigrants | Cambodia | 0.1 /100 | #282 | Tragic 18.1% |
| Nigerians | 0.1 /100 | #283 | Tragic 18.1% |
| Immigrants | Uganda | 0.1 /100 | #284 | Tragic 18.1% |
| Bermudans | 0.1 /100 | #285 | Tragic 18.1% |
| Kenyans | 0.1 /100 | #286 | Tragic 18.1% |
| Dutch West Indians | 0.1 /100 | #287 | Tragic 18.1% |
| Immigrants | West Indies | 0.1 /100 | #288 | Tragic 18.1% |
| Natives/Alaskans | 0.1 /100 | #289 | Tragic 18.1% |
| Immigrants | Africa | 0.1 /100 | #290 | Tragic 18.1% |
| Ottawa | 0.1 /100 | #291 | Tragic 18.2% |
| Iroquois | 0.1 /100 | #292 | Tragic 18.2% |
| Central American Indians | 0.1 /100 | #293 | Tragic 18.2% |
| British West Indians | 0.1 /100 | #294 | Tragic 18.2% |
| German Russians | 0.0 /100 | #295 | Tragic 18.2% |