Iroquois vs Taiwanese Ambulatory Disability
COMPARE
Iroquois
Taiwanese
Ambulatory Disability
Ambulatory Disability Comparison
Iroquois
Taiwanese
7.1%
AMBULATORY DISABILITY
0.0/ 100
METRIC RATING
306th/ 347
METRIC RANK
5.6%
AMBULATORY DISABILITY
99.8/ 100
METRIC RATING
51st/ 347
METRIC RANK
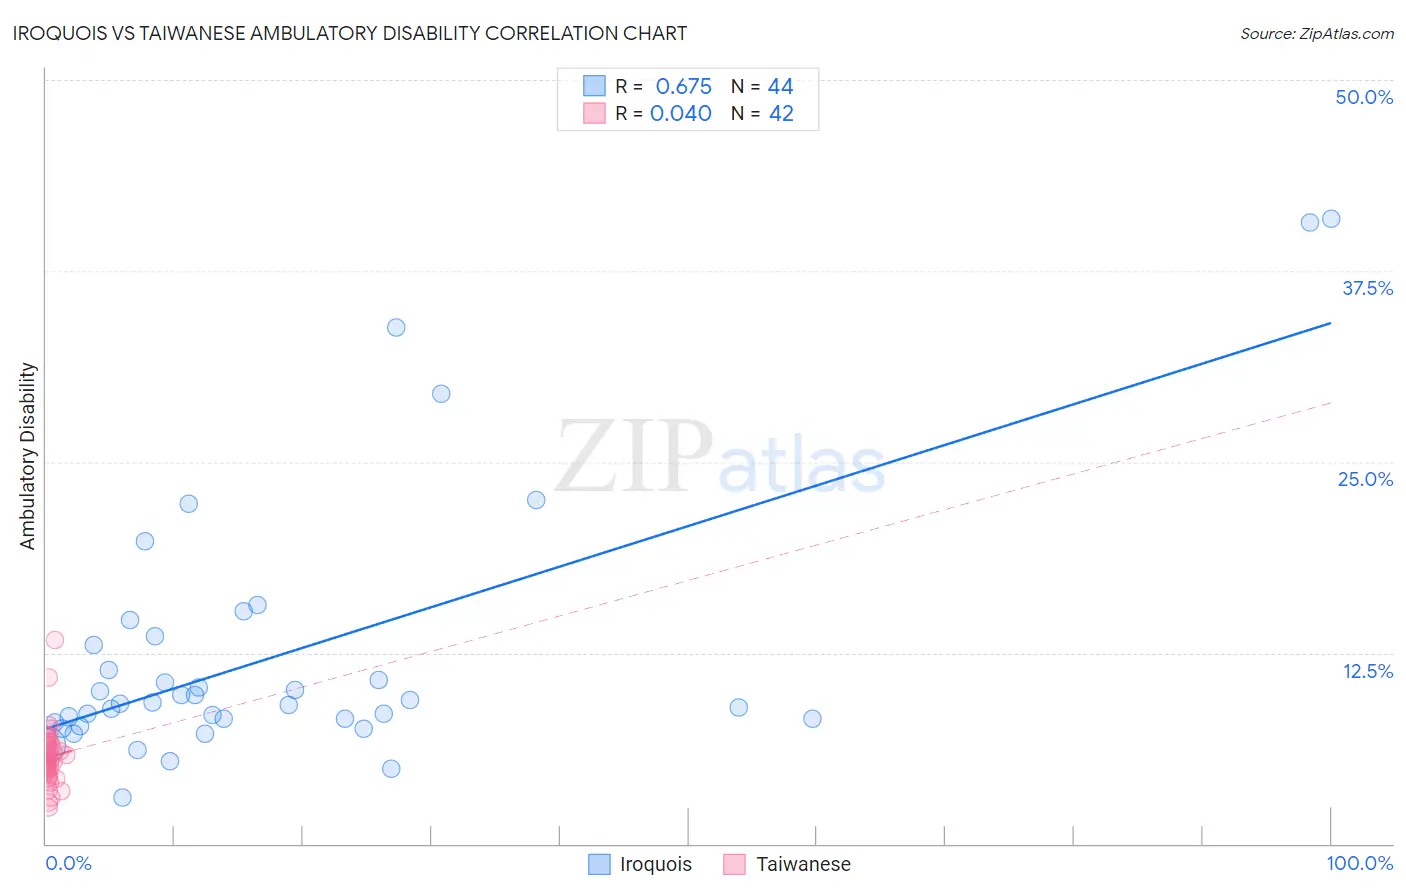
Iroquois vs Taiwanese Ambulatory Disability Correlation Chart
The statistical analysis conducted on geographies consisting of 207,272,935 people shows a significant positive correlation between the proportion of Iroquois and percentage of population with ambulatory disability in the United States with a correlation coefficient (R) of 0.675 and weighted average of 7.1%. Similarly, the statistical analysis conducted on geographies consisting of 31,722,995 people shows no correlation between the proportion of Taiwanese and percentage of population with ambulatory disability in the United States with a correlation coefficient (R) of 0.040 and weighted average of 5.6%, a difference of 26.1%.
Ambulatory Disability Correlation Summary
| Measurement | Iroquois | Taiwanese |
| Minimum | 3.0% | 2.4% |
| Maximum | 40.9% | 13.3% |
| Range | 37.9% | 11.0% |
| Mean | 12.5% | 5.7% |
| Median | 9.2% | 5.4% |
| Interquartile 25% (IQ1) | 8.0% | 4.7% |
| Interquartile 75% (IQ3) | 13.3% | 6.5% |
| Interquartile Range (IQR) | 5.2% | 1.8% |
| Standard Deviation (Sample) | 8.7% | 1.9% |
| Standard Deviation (Population) | 8.6% | 1.9% |
Similar Demographics by Ambulatory Disability
Demographics Similar to Iroquois by Ambulatory Disability
In terms of ambulatory disability, the demographic groups most similar to Iroquois are Spanish American (7.1%, a difference of 0.26%), Chippewa (7.1%, a difference of 0.27%), Immigrants from the Azores (7.1%, a difference of 0.44%), Immigrants from Micronesia (7.0%, a difference of 0.53%), and Arapaho (7.1%, a difference of 0.72%).
| Demographics | Rating | Rank | Ambulatory Disability |
| Puget Sound Salish | 0.0 /100 | #299 | Tragic 6.9% |
| Marshallese | 0.0 /100 | #300 | Tragic 6.9% |
| British West Indians | 0.0 /100 | #301 | Tragic 7.0% |
| Immigrants | Armenia | 0.0 /100 | #302 | Tragic 7.0% |
| Africans | 0.0 /100 | #303 | Tragic 7.0% |
| Immigrants | Cabo Verde | 0.0 /100 | #304 | Tragic 7.0% |
| Immigrants | Micronesia | 0.0 /100 | #305 | Tragic 7.0% |
| Iroquois | 0.0 /100 | #306 | Tragic 7.1% |
| Spanish Americans | 0.0 /100 | #307 | Tragic 7.1% |
| Chippewa | 0.0 /100 | #308 | Tragic 7.1% |
| Immigrants | Azores | 0.0 /100 | #309 | Tragic 7.1% |
| Arapaho | 0.0 /100 | #310 | Tragic 7.1% |
| Cree | 0.0 /100 | #311 | Tragic 7.1% |
| Delaware | 0.0 /100 | #312 | Tragic 7.1% |
| Immigrants | Yemen | 0.0 /100 | #313 | Tragic 7.1% |
Demographics Similar to Taiwanese by Ambulatory Disability
In terms of ambulatory disability, the demographic groups most similar to Taiwanese are Jordanian (5.6%, a difference of 0.090%), Luxembourger (5.6%, a difference of 0.10%), Immigrants from Egypt (5.6%, a difference of 0.10%), Immigrants from Eastern Africa (5.6%, a difference of 0.15%), and Immigrants from Bulgaria (5.6%, a difference of 0.21%).
| Demographics | Rating | Rank | Ambulatory Disability |
| Immigrants | Indonesia | 99.9 /100 | #44 | Exceptional 5.5% |
| Immigrants | Sweden | 99.9 /100 | #45 | Exceptional 5.6% |
| Egyptians | 99.9 /100 | #46 | Exceptional 5.6% |
| Immigrants | Japan | 99.9 /100 | #47 | Exceptional 5.6% |
| Immigrants | Argentina | 99.9 /100 | #48 | Exceptional 5.6% |
| Bulgarians | 99.9 /100 | #49 | Exceptional 5.6% |
| Luxembourgers | 99.9 /100 | #50 | Exceptional 5.6% |
| Taiwanese | 99.8 /100 | #51 | Exceptional 5.6% |
| Jordanians | 99.8 /100 | #52 | Exceptional 5.6% |
| Immigrants | Egypt | 99.8 /100 | #53 | Exceptional 5.6% |
| Immigrants | Eastern Africa | 99.8 /100 | #54 | Exceptional 5.6% |
| Immigrants | Bulgaria | 99.8 /100 | #55 | Exceptional 5.6% |
| Inupiat | 99.8 /100 | #56 | Exceptional 5.6% |
| Immigrants | Brazil | 99.8 /100 | #57 | Exceptional 5.6% |
| Immigrants | Zimbabwe | 99.8 /100 | #58 | Exceptional 5.6% |