Immigrants from Indonesia vs Iranian Hearing Disability
COMPARE
Immigrants from Indonesia
Iranian
Hearing Disability
Hearing Disability Comparison
Immigrants from Indonesia
Iranians
2.8%
HEARING DISABILITY
94.7/ 100
METRIC RATING
103rd/ 347
METRIC RANK
2.8%
HEARING DISABILITY
96.4/ 100
METRIC RATING
92nd/ 347
METRIC RANK
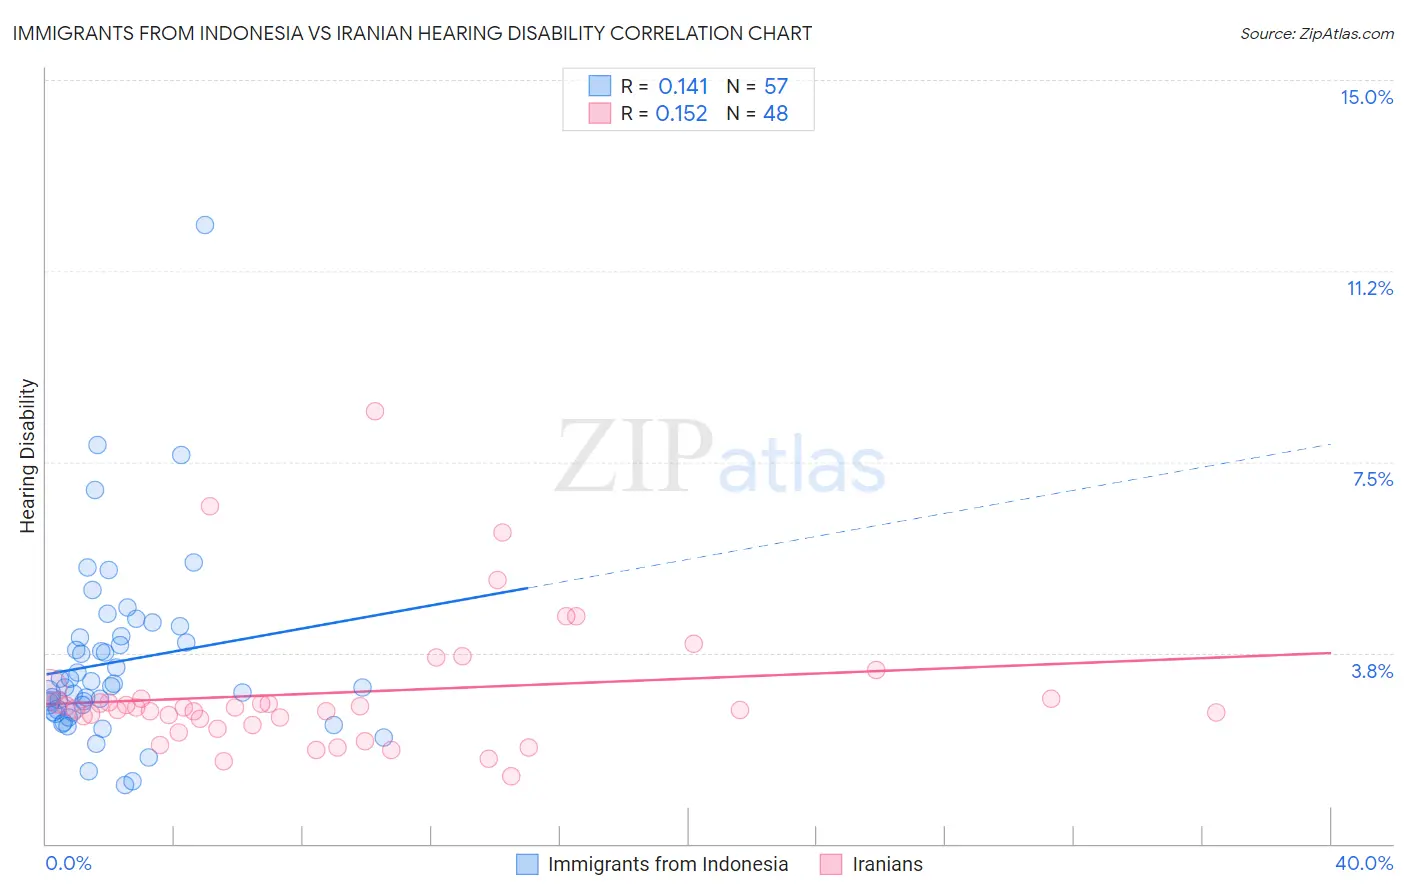
Immigrants from Indonesia vs Iranian Hearing Disability Correlation Chart
The statistical analysis conducted on geographies consisting of 215,771,622 people shows a poor positive correlation between the proportion of Immigrants from Indonesia and percentage of population with hearing disability in the United States with a correlation coefficient (R) of 0.141 and weighted average of 2.8%. Similarly, the statistical analysis conducted on geographies consisting of 316,808,830 people shows a poor positive correlation between the proportion of Iranians and percentage of population with hearing disability in the United States with a correlation coefficient (R) of 0.152 and weighted average of 2.8%, a difference of 1.0%.
Hearing Disability Correlation Summary
| Measurement | Immigrants from Indonesia | Iranian |
| Minimum | 1.2% | 1.3% |
| Maximum | 12.2% | 8.5% |
| Range | 11.0% | 7.2% |
| Mean | 3.6% | 3.0% |
| Median | 3.1% | 2.7% |
| Interquartile 25% (IQ1) | 2.6% | 2.4% |
| Interquartile 75% (IQ3) | 4.1% | 2.8% |
| Interquartile Range (IQR) | 1.5% | 0.46% |
| Standard Deviation (Sample) | 1.8% | 1.3% |
| Standard Deviation (Population) | 1.8% | 1.3% |
Demographics Similar to Immigrants from Indonesia and Iranians by Hearing Disability
In terms of hearing disability, the demographic groups most similar to Immigrants from Indonesia are Taiwanese (2.8%, a difference of 0.050%), Immigrants from Spain (2.8%, a difference of 0.060%), Immigrants from Eastern Africa (2.8%, a difference of 0.12%), Immigrants from Guatemala (2.8%, a difference of 0.17%), and Immigrants from Honduras (2.8%, a difference of 0.21%). Similarly, the demographic groups most similar to Iranians are Immigrants from Middle Africa (2.8%, a difference of 0.030%), Immigrants from Morocco (2.8%, a difference of 0.11%), Immigrants from Kuwait (2.8%, a difference of 0.12%), Belizean (2.8%, a difference of 0.14%), and Immigrants from Turkey (2.8%, a difference of 0.17%).
| Demographics | Rating | Rank | Hearing Disability |
| Somalis | 96.7 /100 | #87 | Exceptional 2.8% |
| Immigrants | Turkey | 96.7 /100 | #88 | Exceptional 2.8% |
| Belizeans | 96.6 /100 | #89 | Exceptional 2.8% |
| Immigrants | Morocco | 96.6 /100 | #90 | Exceptional 2.8% |
| Immigrants | Middle Africa | 96.5 /100 | #91 | Exceptional 2.8% |
| Iranians | 96.4 /100 | #92 | Exceptional 2.8% |
| Immigrants | Kuwait | 96.3 /100 | #93 | Exceptional 2.8% |
| Uruguayans | 95.9 /100 | #94 | Exceptional 2.8% |
| Israelis | 95.9 /100 | #95 | Exceptional 2.8% |
| Immigrants | Somalia | 95.5 /100 | #96 | Exceptional 2.8% |
| Immigrants | Afghanistan | 95.3 /100 | #97 | Exceptional 2.8% |
| Immigrants | Honduras | 95.1 /100 | #98 | Exceptional 2.8% |
| Immigrants | Guatemala | 95.1 /100 | #99 | Exceptional 2.8% |
| Immigrants | Eastern Africa | 95.0 /100 | #100 | Exceptional 2.8% |
| Immigrants | Spain | 94.9 /100 | #101 | Exceptional 2.8% |
| Taiwanese | 94.8 /100 | #102 | Exceptional 2.8% |
| Immigrants | Indonesia | 94.7 /100 | #103 | Exceptional 2.8% |
| Burmese | 94.2 /100 | #104 | Exceptional 2.8% |
| Moroccans | 93.9 /100 | #105 | Exceptional 2.8% |
| Hondurans | 93.4 /100 | #106 | Exceptional 2.8% |
| Immigrants | Chile | 93.4 /100 | #107 | Exceptional 2.8% |