Iroquois vs Bermudan Disability Age 65 to 74
COMPARE
Iroquois
Bermudan
Disability Age 65 to 74
Disability Age 65 to 74 Comparison
Iroquois
Bermudans
25.4%
DISABILITY AGE 65 TO 74
0.2/ 100
METRIC RATING
263rd/ 347
METRIC RANK
24.2%
DISABILITY AGE 65 TO 74
8.2/ 100
METRIC RATING
225th/ 347
METRIC RANK
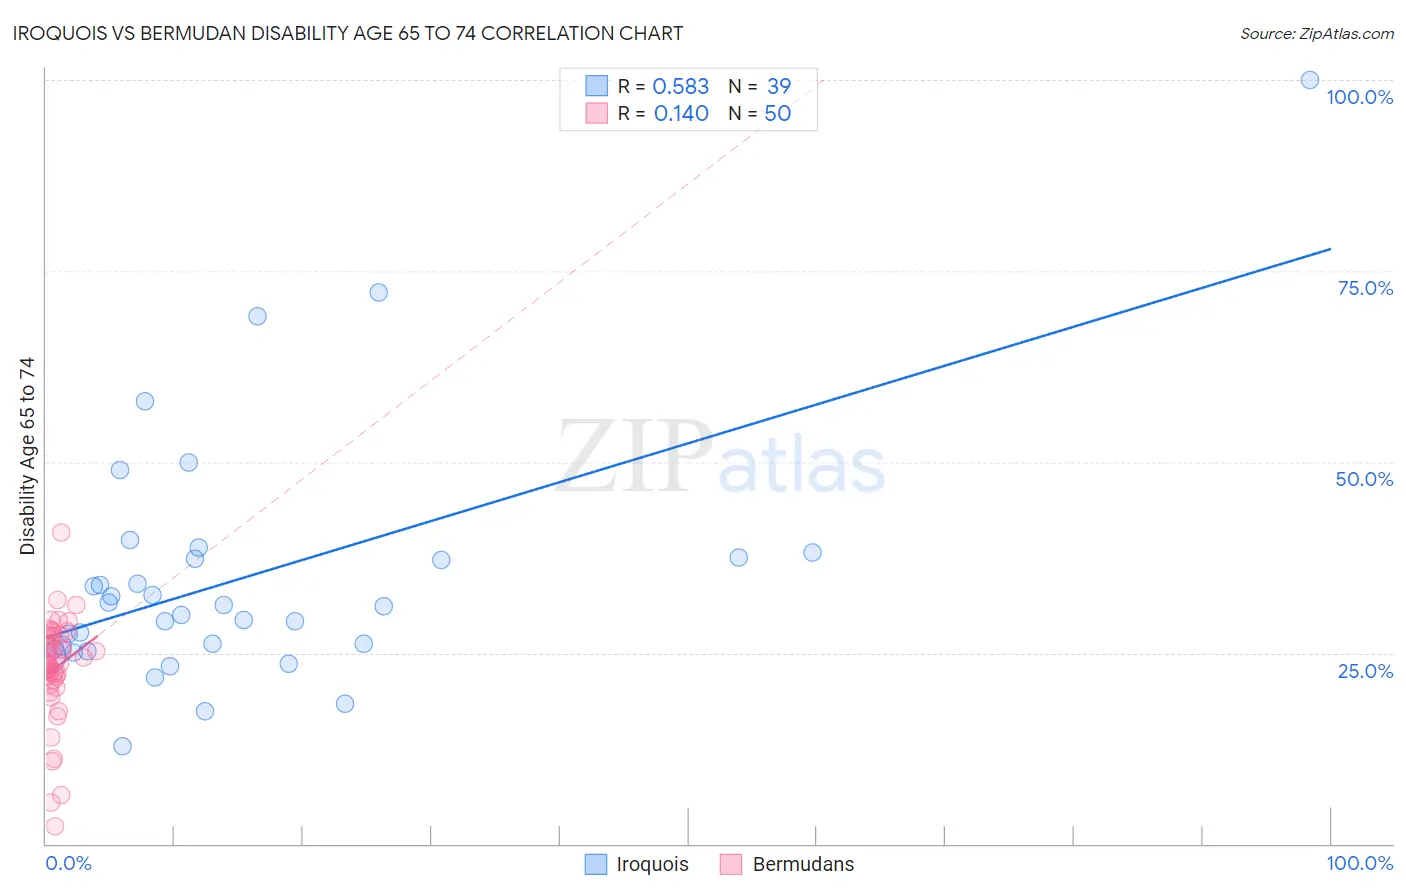
Iroquois vs Bermudan Disability Age 65 to 74 Correlation Chart
The statistical analysis conducted on geographies consisting of 207,066,685 people shows a substantial positive correlation between the proportion of Iroquois and percentage of population with a disability between the ages 65 and 75 in the United States with a correlation coefficient (R) of 0.583 and weighted average of 25.4%. Similarly, the statistical analysis conducted on geographies consisting of 55,715,607 people shows a poor positive correlation between the proportion of Bermudans and percentage of population with a disability between the ages 65 and 75 in the United States with a correlation coefficient (R) of 0.140 and weighted average of 24.2%, a difference of 5.3%.
Disability Age 65 to 74 Correlation Summary
| Measurement | Iroquois | Bermudan |
| Minimum | 12.8% | 2.3% |
| Maximum | 100.0% | 40.7% |
| Range | 87.2% | 38.4% |
| Mean | 34.8% | 23.0% |
| Median | 31.1% | 23.8% |
| Interquartile 25% (IQ1) | 25.6% | 21.4% |
| Interquartile 75% (IQ3) | 37.6% | 27.2% |
| Interquartile Range (IQR) | 12.0% | 5.8% |
| Standard Deviation (Sample) | 16.4% | 6.9% |
| Standard Deviation (Population) | 16.2% | 6.8% |
Similar Demographics by Disability Age 65 to 74
Demographics Similar to Iroquois by Disability Age 65 to 74
In terms of disability age 65 to 74, the demographic groups most similar to Iroquois are Samoan (25.4%, a difference of 0.010%), Cape Verdean (25.4%, a difference of 0.10%), Malaysian (25.4%, a difference of 0.18%), Hawaiian (25.5%, a difference of 0.34%), and Guatemalan (25.5%, a difference of 0.39%).
| Demographics | Rating | Rank | Disability Age 65 to 74 |
| Immigrants | Somalia | 0.4 /100 | #256 | Tragic 25.2% |
| Guamanians/Chamorros | 0.3 /100 | #257 | Tragic 25.3% |
| Marshallese | 0.3 /100 | #258 | Tragic 25.3% |
| Immigrants | Cambodia | 0.3 /100 | #259 | Tragic 25.3% |
| Malaysians | 0.2 /100 | #260 | Tragic 25.4% |
| Cape Verdeans | 0.2 /100 | #261 | Tragic 25.4% |
| Samoans | 0.2 /100 | #262 | Tragic 25.4% |
| Iroquois | 0.2 /100 | #263 | Tragic 25.4% |
| Hawaiians | 0.2 /100 | #264 | Tragic 25.5% |
| Guatemalans | 0.2 /100 | #265 | Tragic 25.5% |
| Immigrants | Latin America | 0.1 /100 | #266 | Tragic 25.6% |
| Ottawa | 0.1 /100 | #267 | Tragic 25.6% |
| Liberians | 0.1 /100 | #268 | Tragic 25.6% |
| Hmong | 0.1 /100 | #269 | Tragic 25.7% |
| Immigrants | Guatemala | 0.1 /100 | #270 | Tragic 25.7% |
Demographics Similar to Bermudans by Disability Age 65 to 74
In terms of disability age 65 to 74, the demographic groups most similar to Bermudans are Iraqi (24.2%, a difference of 0.010%), Nigerian (24.2%, a difference of 0.070%), Immigrants from Panama (24.1%, a difference of 0.090%), Immigrants from Middle Africa (24.1%, a difference of 0.13%), and Native Hawaiian (24.1%, a difference of 0.20%).
| Demographics | Rating | Rank | Disability Age 65 to 74 |
| Immigrants | Nigeria | 11.7 /100 | #218 | Poor 24.0% |
| Immigrants | Burma/Myanmar | 11.6 /100 | #219 | Poor 24.0% |
| Ghanaians | 10.4 /100 | #220 | Poor 24.1% |
| Immigrants | Nicaragua | 9.8 /100 | #221 | Tragic 24.1% |
| Native Hawaiians | 9.3 /100 | #222 | Tragic 24.1% |
| Immigrants | Middle Africa | 8.9 /100 | #223 | Tragic 24.1% |
| Immigrants | Panama | 8.6 /100 | #224 | Tragic 24.1% |
| Bermudans | 8.2 /100 | #225 | Tragic 24.2% |
| Iraqis | 8.1 /100 | #226 | Tragic 24.2% |
| Nigerians | 7.8 /100 | #227 | Tragic 24.2% |
| Whites/Caucasians | 6.6 /100 | #228 | Tragic 24.2% |
| Celtics | 6.4 /100 | #229 | Tragic 24.2% |
| Barbadians | 6.0 /100 | #230 | Tragic 24.3% |
| Immigrants | Thailand | 5.2 /100 | #231 | Tragic 24.3% |
| Immigrants | Zaire | 5.0 /100 | #232 | Tragic 24.3% |