Iranian vs Northern European Unemployment Among Ages 25 to 29 years
COMPARE
Iranian
Northern European
Unemployment Among Ages 25 to 29 years
Unemployment Among Ages 25 to 29 years Comparison
Iranians
Northern Europeans
6.3%
UNEMPLOYMENT AMONG AGES 25 TO 29 YEARS
95.8/ 100
METRIC RATING
81st/ 347
METRIC RANK
6.5%
UNEMPLOYMENT AMONG AGES 25 TO 29 YEARS
75.4/ 100
METRIC RATING
136th/ 347
METRIC RANK
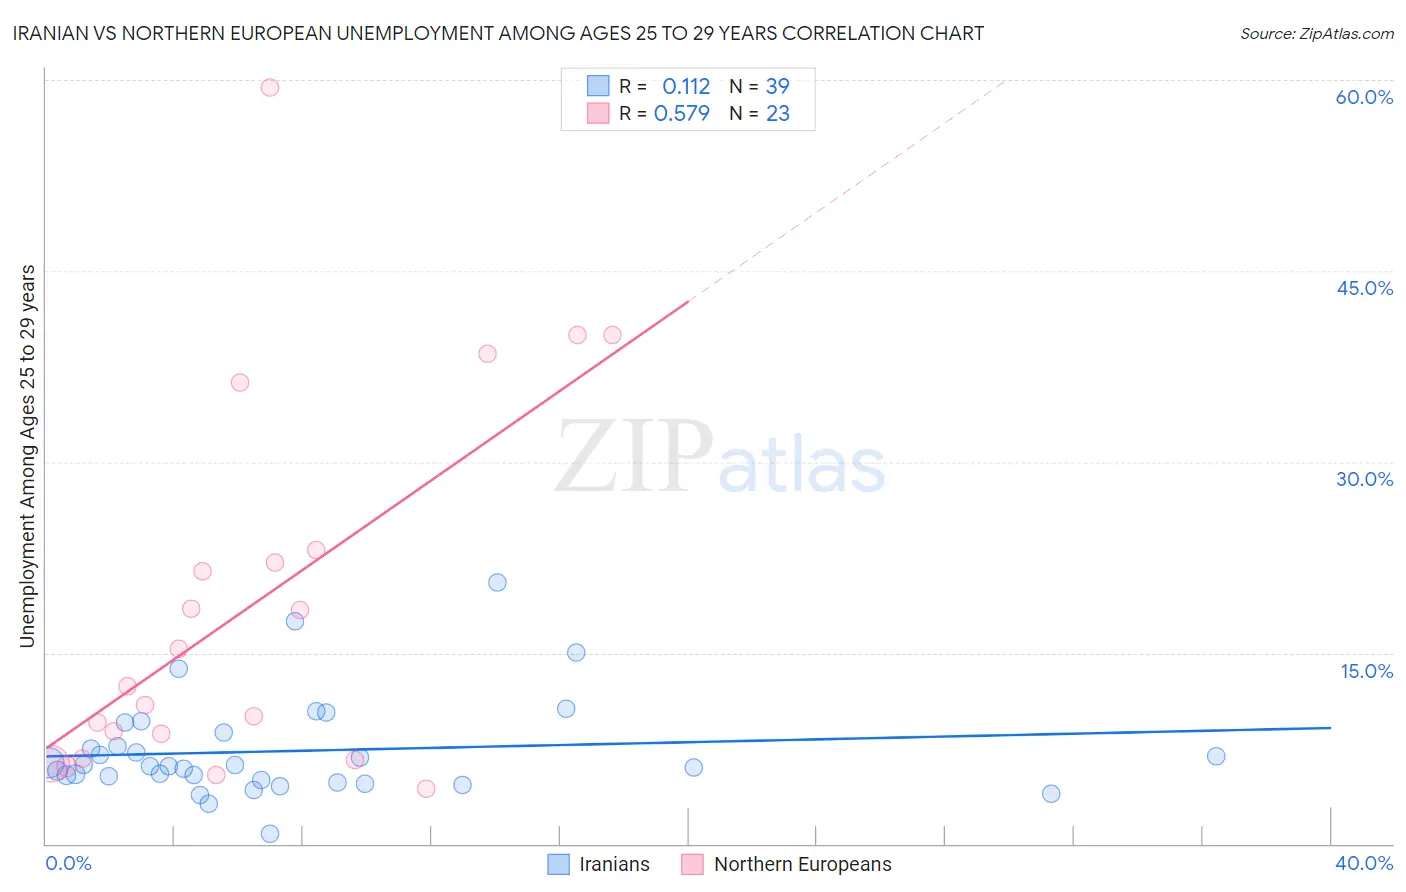
Iranian vs Northern European Unemployment Among Ages 25 to 29 years Correlation Chart
The statistical analysis conducted on geographies consisting of 305,911,685 people shows a poor positive correlation between the proportion of Iranians and unemployment rate among population between the ages 25 and 29 in the United States with a correlation coefficient (R) of 0.112 and weighted average of 6.3%. Similarly, the statistical analysis conducted on geographies consisting of 379,973,816 people shows a substantial positive correlation between the proportion of Northern Europeans and unemployment rate among population between the ages 25 and 29 in the United States with a correlation coefficient (R) of 0.579 and weighted average of 6.5%, a difference of 3.2%.
Unemployment Among Ages 25 to 29 years Correlation Summary
| Measurement | Iranian | Northern European |
| Minimum | 0.80% | 4.3% |
| Maximum | 20.5% | 59.4% |
| Range | 19.7% | 55.1% |
| Mean | 7.3% | 18.6% |
| Median | 6.1% | 12.3% |
| Interquartile 25% (IQ1) | 5.0% | 6.7% |
| Interquartile 75% (IQ3) | 8.8% | 23.1% |
| Interquartile Range (IQR) | 3.7% | 16.4% |
| Standard Deviation (Sample) | 3.9% | 14.7% |
| Standard Deviation (Population) | 3.9% | 14.4% |
Similar Demographics by Unemployment Among Ages 25 to 29 years
Demographics Similar to Iranians by Unemployment Among Ages 25 to 29 years
In terms of unemployment among ages 25 to 29 years, the demographic groups most similar to Iranians are Immigrants from Romania (6.3%, a difference of 0.040%), Immigrants from Poland (6.3%, a difference of 0.040%), Immigrants from Switzerland (6.3%, a difference of 0.10%), Slovene (6.3%, a difference of 0.17%), and Immigrants from Spain (6.3%, a difference of 0.21%).
| Demographics | Rating | Rank | Unemployment Among Ages 25 to 29 years |
| Carpatho Rusyns | 96.9 /100 | #74 | Exceptional 6.3% |
| Immigrants | Jordan | 96.8 /100 | #75 | Exceptional 6.3% |
| Immigrants | Korea | 96.7 /100 | #76 | Exceptional 6.3% |
| Icelanders | 96.6 /100 | #77 | Exceptional 6.3% |
| Asians | 96.4 /100 | #78 | Exceptional 6.3% |
| Immigrants | Switzerland | 96.0 /100 | #79 | Exceptional 6.3% |
| Immigrants | Romania | 95.9 /100 | #80 | Exceptional 6.3% |
| Iranians | 95.8 /100 | #81 | Exceptional 6.3% |
| Immigrants | Poland | 95.7 /100 | #82 | Exceptional 6.3% |
| Slovenes | 95.3 /100 | #83 | Exceptional 6.3% |
| Immigrants | Spain | 95.2 /100 | #84 | Exceptional 6.3% |
| Immigrants | Sweden | 95.1 /100 | #85 | Exceptional 6.3% |
| Immigrants | Asia | 94.9 /100 | #86 | Exceptional 6.3% |
| Marshallese | 94.7 /100 | #87 | Exceptional 6.4% |
| Immigrants | Indonesia | 94.5 /100 | #88 | Exceptional 6.4% |
Demographics Similar to Northern Europeans by Unemployment Among Ages 25 to 29 years
In terms of unemployment among ages 25 to 29 years, the demographic groups most similar to Northern Europeans are Immigrants from Croatia (6.5%, a difference of 0.010%), Immigrants from Vietnam (6.5%, a difference of 0.020%), Immigrants from Europe (6.5%, a difference of 0.030%), Polish (6.5%, a difference of 0.11%), and Eastern European (6.5%, a difference of 0.11%).
| Demographics | Rating | Rank | Unemployment Among Ages 25 to 29 years |
| Sri Lankans | 80.3 /100 | #129 | Excellent 6.5% |
| Immigrants | Peru | 79.9 /100 | #130 | Good 6.5% |
| Immigrants | Afghanistan | 79.2 /100 | #131 | Good 6.5% |
| Poles | 76.6 /100 | #132 | Good 6.5% |
| Immigrants | Europe | 75.7 /100 | #133 | Good 6.5% |
| Immigrants | Vietnam | 75.6 /100 | #134 | Good 6.5% |
| Immigrants | Croatia | 75.5 /100 | #135 | Good 6.5% |
| Northern Europeans | 75.4 /100 | #136 | Good 6.5% |
| Eastern Europeans | 74.1 /100 | #137 | Good 6.5% |
| Immigrants | Belgium | 73.8 /100 | #138 | Good 6.5% |
| Austrians | 73.8 /100 | #139 | Good 6.5% |
| Immigrants | Pakistan | 73.8 /100 | #140 | Good 6.5% |
| Maltese | 72.9 /100 | #141 | Good 6.5% |
| Slavs | 72.5 /100 | #142 | Good 6.5% |
| Lithuanians | 72.2 /100 | #143 | Good 6.5% |