Immigrants from Jamaica vs Tsimshian Vision Disability
COMPARE
Immigrants from Jamaica
Tsimshian
Vision Disability
Vision Disability Comparison
Immigrants from Jamaica
Tsimshian
2.4%
VISION DISABILITY
0.1/ 100
METRIC RATING
265th/ 347
METRIC RANK
3.2%
VISION DISABILITY
0.0/ 100
METRIC RATING
339th/ 347
METRIC RANK
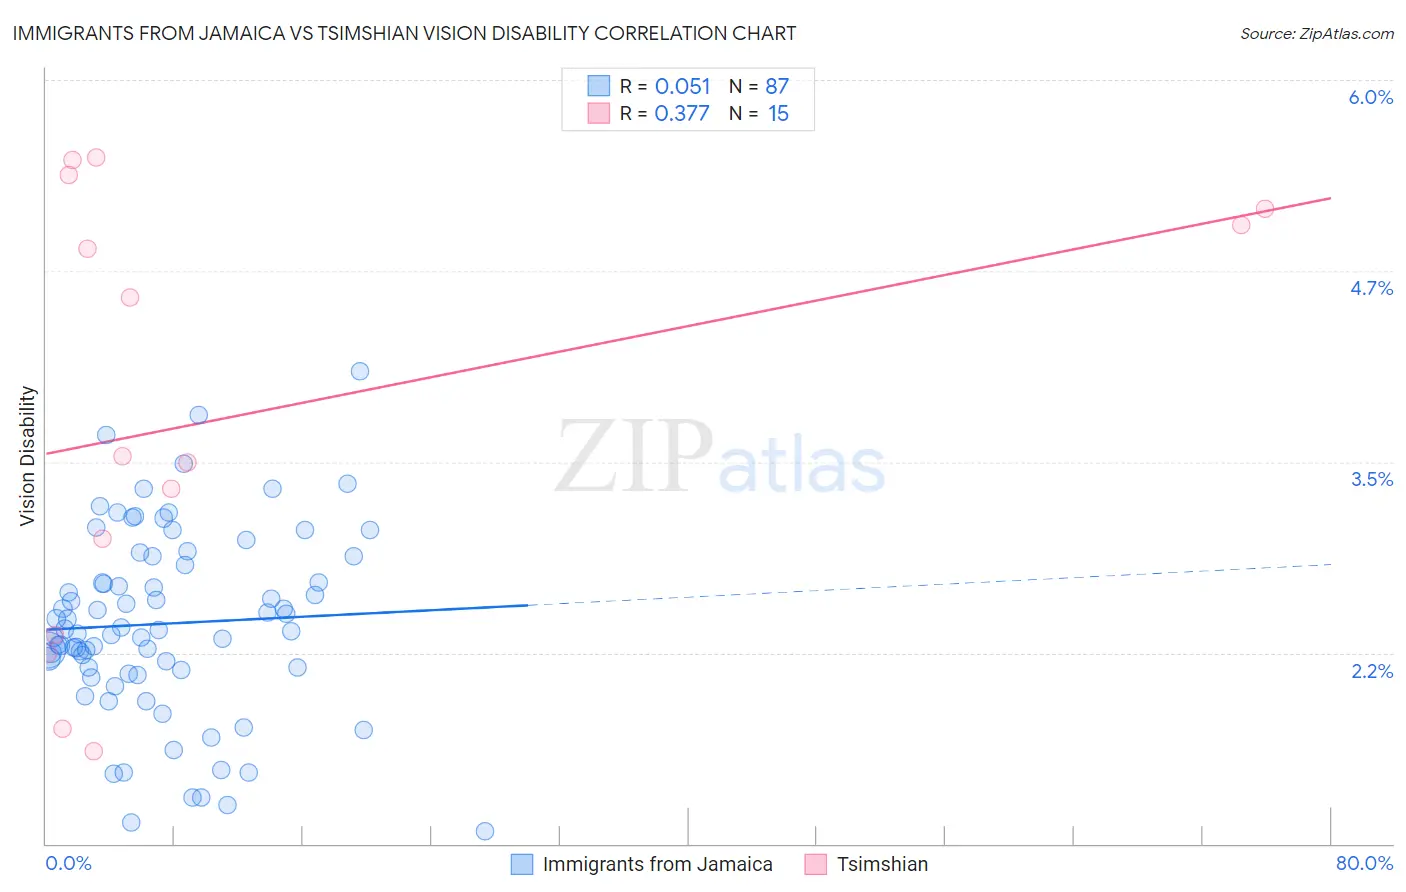
Immigrants from Jamaica vs Tsimshian Vision Disability Correlation Chart
The statistical analysis conducted on geographies consisting of 301,593,717 people shows a slight positive correlation between the proportion of Immigrants from Jamaica and percentage of population with vision disability in the United States with a correlation coefficient (R) of 0.051 and weighted average of 2.4%. Similarly, the statistical analysis conducted on geographies consisting of 15,626,544 people shows a mild positive correlation between the proportion of Tsimshian and percentage of population with vision disability in the United States with a correlation coefficient (R) of 0.377 and weighted average of 3.2%, a difference of 33.5%.
Vision Disability Correlation Summary
| Measurement | Immigrants from Jamaica | Tsimshian |
| Minimum | 1.1% | 1.6% |
| Maximum | 4.1% | 5.5% |
| Range | 3.0% | 3.9% |
| Mean | 2.4% | 3.8% |
| Median | 2.4% | 3.5% |
| Interquartile 25% (IQ1) | 2.1% | 2.4% |
| Interquartile 75% (IQ3) | 2.9% | 5.2% |
| Interquartile Range (IQR) | 0.75% | 2.8% |
| Standard Deviation (Sample) | 0.61% | 1.4% |
| Standard Deviation (Population) | 0.61% | 1.4% |
Similar Demographics by Vision Disability
Demographics Similar to Immigrants from Jamaica by Vision Disability
In terms of vision disability, the demographic groups most similar to Immigrants from Jamaica are Immigrants from Liberia (2.4%, a difference of 0.020%), Mexican American Indian (2.4%, a difference of 0.040%), Ute (2.4%, a difference of 0.050%), Immigrants from Belize (2.4%, a difference of 0.14%), and Senegalese (2.4%, a difference of 0.14%).
| Demographics | Rating | Rank | Vision Disability |
| British West Indians | 0.2 /100 | #258 | Tragic 2.4% |
| Whites/Caucasians | 0.2 /100 | #259 | Tragic 2.4% |
| Belizeans | 0.2 /100 | #260 | Tragic 2.4% |
| Fijians | 0.1 /100 | #261 | Tragic 2.4% |
| Jamaicans | 0.1 /100 | #262 | Tragic 2.4% |
| Immigrants | Belize | 0.1 /100 | #263 | Tragic 2.4% |
| Immigrants | Liberia | 0.1 /100 | #264 | Tragic 2.4% |
| Immigrants | Jamaica | 0.1 /100 | #265 | Tragic 2.4% |
| Mexican American Indians | 0.1 /100 | #266 | Tragic 2.4% |
| Ute | 0.1 /100 | #267 | Tragic 2.4% |
| Senegalese | 0.1 /100 | #268 | Tragic 2.4% |
| Celtics | 0.1 /100 | #269 | Tragic 2.4% |
| Cubans | 0.1 /100 | #270 | Tragic 2.4% |
| Immigrants | Azores | 0.1 /100 | #271 | Tragic 2.4% |
| Spaniards | 0.1 /100 | #272 | Tragic 2.4% |
Demographics Similar to Tsimshian by Vision Disability
In terms of vision disability, the demographic groups most similar to Tsimshian are Creek (3.2%, a difference of 0.13%), Chickasaw (3.2%, a difference of 0.69%), Kiowa (3.3%, a difference of 1.6%), Dutch West Indian (3.2%, a difference of 1.6%), and Alaskan Athabascan (3.1%, a difference of 1.6%).
| Demographics | Rating | Rank | Vision Disability |
| Seminole | 0.0 /100 | #332 | Tragic 3.1% |
| Cajuns | 0.0 /100 | #333 | Tragic 3.1% |
| Cheyenne | 0.0 /100 | #334 | Tragic 3.1% |
| Navajo | 0.0 /100 | #335 | Tragic 3.1% |
| Alaskan Athabascans | 0.0 /100 | #336 | Tragic 3.1% |
| Dutch West Indians | 0.0 /100 | #337 | Tragic 3.2% |
| Chickasaw | 0.0 /100 | #338 | Tragic 3.2% |
| Tsimshian | 0.0 /100 | #339 | Tragic 3.2% |
| Creek | 0.0 /100 | #340 | Tragic 3.2% |
| Kiowa | 0.0 /100 | #341 | Tragic 3.3% |
| Choctaw | 0.0 /100 | #342 | Tragic 3.3% |
| Pima | 0.0 /100 | #343 | Tragic 3.3% |
| Pueblo | 0.0 /100 | #344 | Tragic 3.3% |
| Lumbee | 0.0 /100 | #345 | Tragic 3.4% |
| Houma | 0.0 /100 | #346 | Tragic 3.4% |