Immigrants from Yemen vs Fijian Disability Age Over 75
COMPARE
Immigrants from Yemen
Fijian
Disability Age Over 75
Disability Age Over 75 Comparison
Immigrants from Yemen
Fijians
52.0%
DISABILITY AGE OVER 75
0.0/ 100
METRIC RATING
323rd/ 347
METRIC RANK
49.0%
DISABILITY AGE OVER 75
0.2/ 100
METRIC RATING
271st/ 347
METRIC RANK
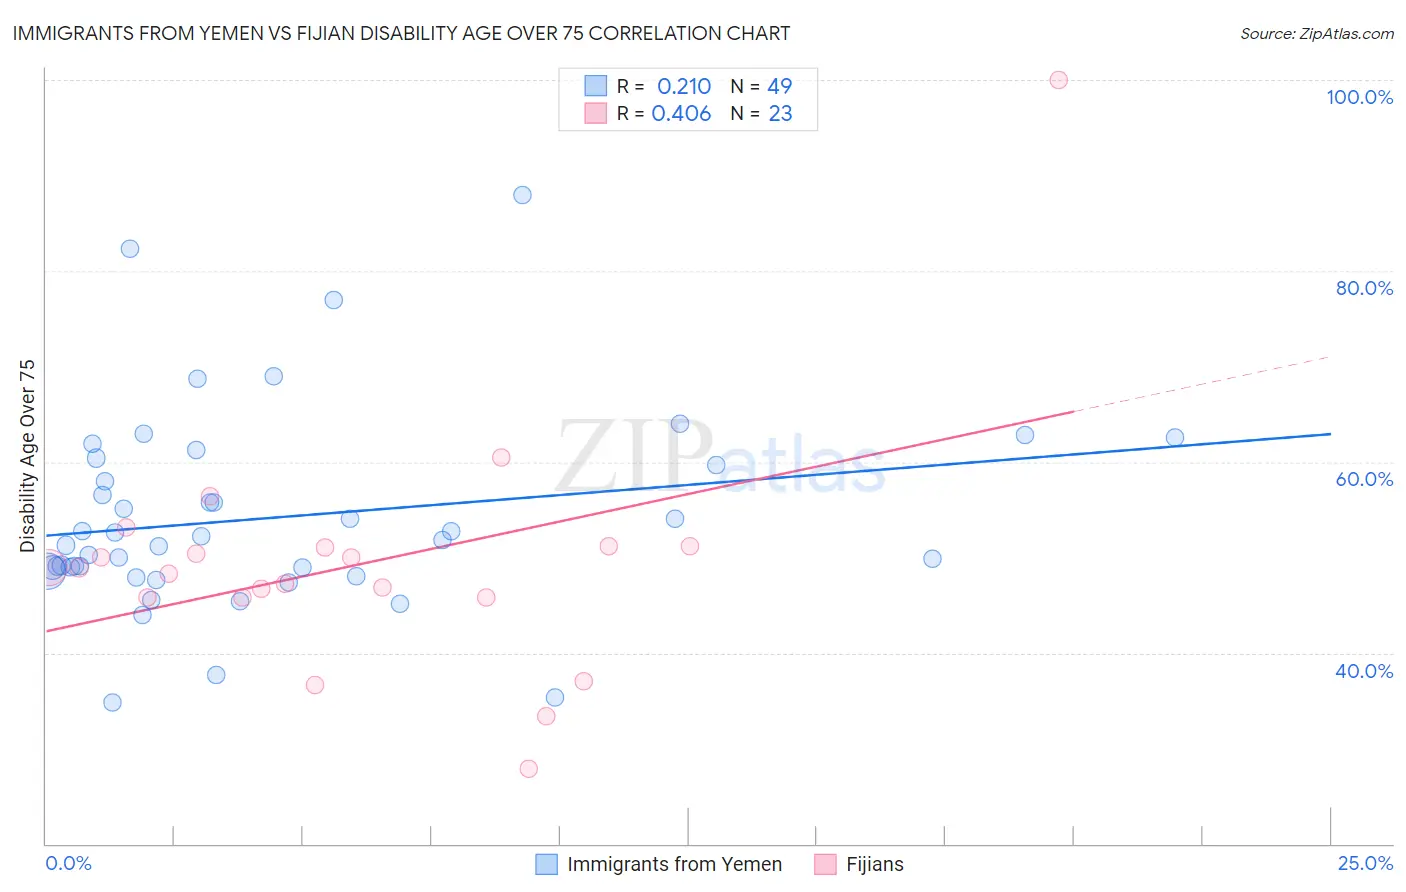
Immigrants from Yemen vs Fijian Disability Age Over 75 Correlation Chart
The statistical analysis conducted on geographies consisting of 82,401,520 people shows a weak positive correlation between the proportion of Immigrants from Yemen and percentage of population with a disability over the age of 75 in the United States with a correlation coefficient (R) of 0.210 and weighted average of 52.0%. Similarly, the statistical analysis conducted on geographies consisting of 55,916,518 people shows a moderate positive correlation between the proportion of Fijians and percentage of population with a disability over the age of 75 in the United States with a correlation coefficient (R) of 0.406 and weighted average of 49.0%, a difference of 6.0%.
Disability Age Over 75 Correlation Summary
| Measurement | Immigrants from Yemen | Fijian |
| Minimum | 34.8% | 27.8% |
| Maximum | 88.0% | 100.0% |
| Range | 53.2% | 72.2% |
| Mean | 54.2% | 49.3% |
| Median | 51.8% | 48.9% |
| Interquartile 25% (IQ1) | 48.7% | 45.8% |
| Interquartile 75% (IQ3) | 60.0% | 51.2% |
| Interquartile Range (IQR) | 11.3% | 5.4% |
| Standard Deviation (Sample) | 10.4% | 13.2% |
| Standard Deviation (Population) | 10.3% | 12.9% |
Similar Demographics by Disability Age Over 75
Demographics Similar to Immigrants from Yemen by Disability Age Over 75
In terms of disability age over 75, the demographic groups most similar to Immigrants from Yemen are Comanche (51.7%, a difference of 0.52%), Menominee (52.3%, a difference of 0.63%), Immigrants from Cabo Verde (52.4%, a difference of 0.80%), Paiute (51.5%, a difference of 0.86%), and Dutch West Indian (51.5%, a difference of 0.86%).
| Demographics | Rating | Rank | Disability Age Over 75 |
| Chickasaw | 0.0 /100 | #316 | Tragic 51.2% |
| Yakama | 0.0 /100 | #317 | Tragic 51.3% |
| Seminole | 0.0 /100 | #318 | Tragic 51.5% |
| Creek | 0.0 /100 | #319 | Tragic 51.5% |
| Paiute | 0.0 /100 | #320 | Tragic 51.5% |
| Dutch West Indians | 0.0 /100 | #321 | Tragic 51.5% |
| Comanche | 0.0 /100 | #322 | Tragic 51.7% |
| Immigrants | Yemen | 0.0 /100 | #323 | Tragic 52.0% |
| Menominee | 0.0 /100 | #324 | Tragic 52.3% |
| Immigrants | Cabo Verde | 0.0 /100 | #325 | Tragic 52.4% |
| Ute | 0.0 /100 | #326 | Tragic 52.6% |
| Nepalese | 0.0 /100 | #327 | Tragic 52.6% |
| Choctaw | 0.0 /100 | #328 | Tragic 52.7% |
| Alaska Natives | 0.0 /100 | #329 | Tragic 52.8% |
| Puerto Ricans | 0.0 /100 | #330 | Tragic 52.9% |
Demographics Similar to Fijians by Disability Age Over 75
In terms of disability age over 75, the demographic groups most similar to Fijians are Assyrian/Chaldean/Syriac (49.1%, a difference of 0.010%), Potawatomi (49.0%, a difference of 0.020%), Immigrants from El Salvador (49.0%, a difference of 0.050%), Immigrants from Iraq (49.1%, a difference of 0.060%), and Guatemalan (49.0%, a difference of 0.070%).
| Demographics | Rating | Rank | Disability Age Over 75 |
| Immigrants | Honduras | 0.3 /100 | #264 | Tragic 48.9% |
| Hondurans | 0.3 /100 | #265 | Tragic 48.9% |
| U.S. Virgin Islanders | 0.2 /100 | #266 | Tragic 48.9% |
| Malaysians | 0.2 /100 | #267 | Tragic 49.0% |
| Guatemalans | 0.2 /100 | #268 | Tragic 49.0% |
| Immigrants | El Salvador | 0.2 /100 | #269 | Tragic 49.0% |
| Potawatomi | 0.2 /100 | #270 | Tragic 49.0% |
| Fijians | 0.2 /100 | #271 | Tragic 49.0% |
| Assyrians/Chaldeans/Syriacs | 0.2 /100 | #272 | Tragic 49.1% |
| Immigrants | Iraq | 0.1 /100 | #273 | Tragic 49.1% |
| Immigrants | Guatemala | 0.1 /100 | #274 | Tragic 49.1% |
| Immigrants | Dominica | 0.1 /100 | #275 | Tragic 49.1% |
| Immigrants | Uzbekistan | 0.1 /100 | #276 | Tragic 49.2% |
| Hawaiians | 0.1 /100 | #277 | Tragic 49.2% |
| Immigrants | Laos | 0.1 /100 | #278 | Tragic 49.2% |