Immigrants from Western Asia vs Immigrants from Greece Cognitive Disability
COMPARE
Immigrants from Western Asia
Immigrants from Greece
Cognitive Disability
Cognitive Disability Comparison
Immigrants from Western Asia
Immigrants from Greece
17.4%
COGNITIVE DISABILITY
29.5/ 100
METRIC RATING
189th/ 347
METRIC RANK
16.3%
COGNITIVE DISABILITY
100.0/ 100
METRIC RATING
15th/ 347
METRIC RANK
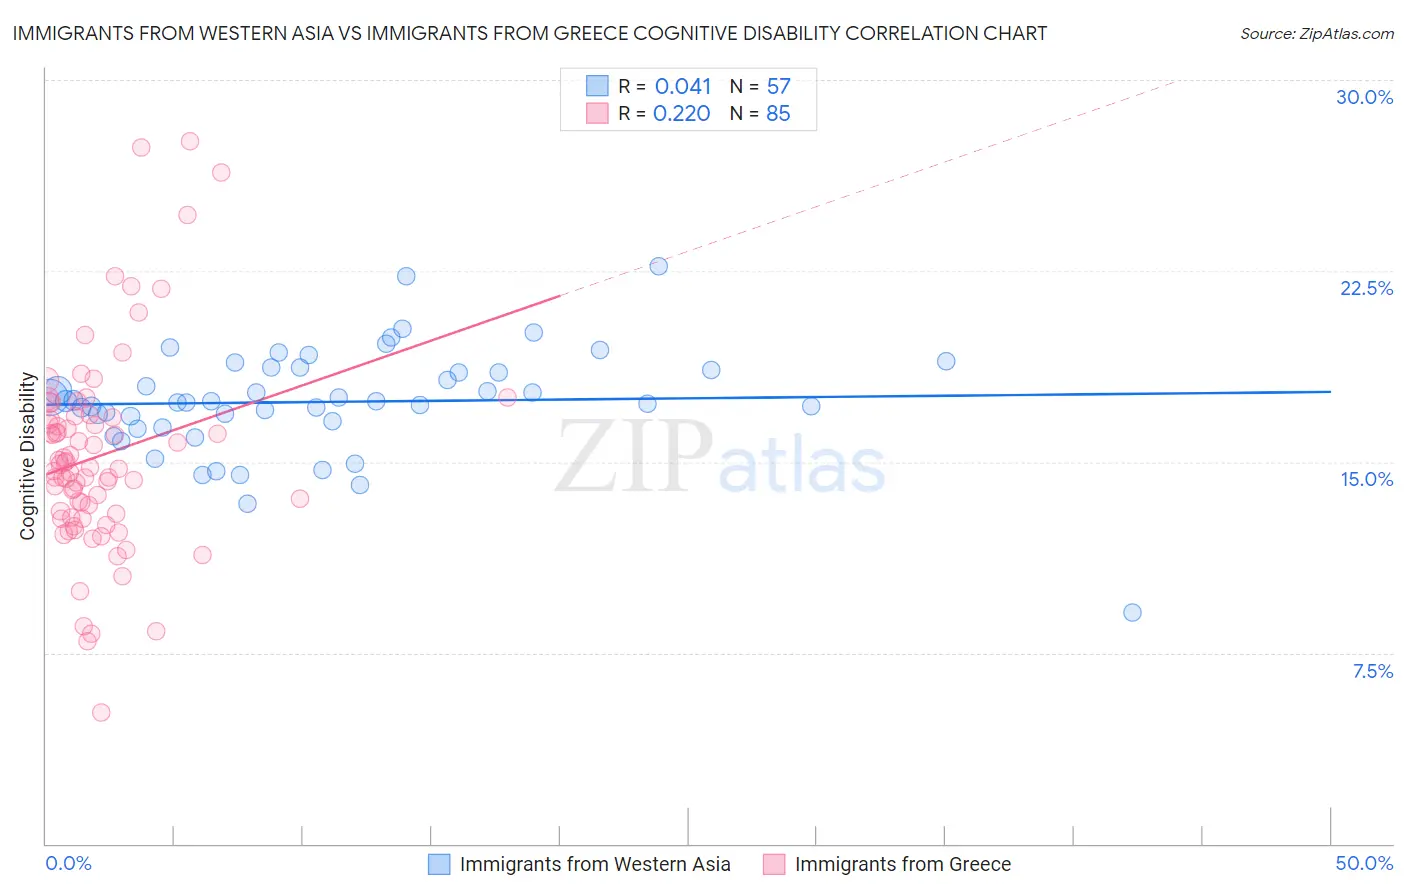
Immigrants from Western Asia vs Immigrants from Greece Cognitive Disability Correlation Chart
The statistical analysis conducted on geographies consisting of 404,418,073 people shows no correlation between the proportion of Immigrants from Western Asia and percentage of population with cognitive disability in the United States with a correlation coefficient (R) of 0.041 and weighted average of 17.4%. Similarly, the statistical analysis conducted on geographies consisting of 216,873,131 people shows a weak positive correlation between the proportion of Immigrants from Greece and percentage of population with cognitive disability in the United States with a correlation coefficient (R) of 0.220 and weighted average of 16.3%, a difference of 6.9%.
Cognitive Disability Correlation Summary
| Measurement | Immigrants from Western Asia | Immigrants from Greece |
| Minimum | 9.1% | 5.2% |
| Maximum | 22.7% | 27.6% |
| Range | 13.6% | 22.4% |
| Mean | 17.4% | 15.3% |
| Median | 17.4% | 14.8% |
| Interquartile 25% (IQ1) | 16.5% | 12.9% |
| Interquartile 75% (IQ3) | 18.7% | 16.8% |
| Interquartile Range (IQR) | 2.2% | 3.9% |
| Standard Deviation (Sample) | 2.1% | 4.0% |
| Standard Deviation (Population) | 2.1% | 3.9% |
Similar Demographics by Cognitive Disability
Demographics Similar to Immigrants from Western Asia by Cognitive Disability
In terms of cognitive disability, the demographic groups most similar to Immigrants from Western Asia are Immigrants from France (17.4%, a difference of 0.010%), Immigrants from Spain (17.4%, a difference of 0.060%), Nonimmigrants (17.4%, a difference of 0.070%), Immigrants from Haiti (17.4%, a difference of 0.080%), and Immigrants from Fiji (17.4%, a difference of 0.14%).
| Demographics | Rating | Rank | Cognitive Disability |
| Arabs | 42.8 /100 | #182 | Average 17.3% |
| Spaniards | 40.3 /100 | #183 | Average 17.3% |
| Crow | 39.1 /100 | #184 | Fair 17.3% |
| Afghans | 38.2 /100 | #185 | Fair 17.3% |
| Cambodians | 35.9 /100 | #186 | Fair 17.3% |
| Immigrants | Fiji | 33.7 /100 | #187 | Fair 17.4% |
| Immigrants | France | 29.8 /100 | #188 | Fair 17.4% |
| Immigrants | Western Asia | 29.5 /100 | #189 | Fair 17.4% |
| Immigrants | Spain | 27.7 /100 | #190 | Fair 17.4% |
| Immigrants | Nonimmigrants | 27.4 /100 | #191 | Fair 17.4% |
| Immigrants | Haiti | 27.1 /100 | #192 | Fair 17.4% |
| Delaware | 25.6 /100 | #193 | Fair 17.4% |
| Immigrants | Bosnia and Herzegovina | 22.0 /100 | #194 | Fair 17.4% |
| New Zealanders | 21.1 /100 | #195 | Fair 17.4% |
| Guyanese | 17.5 /100 | #196 | Poor 17.5% |
Demographics Similar to Immigrants from Greece by Cognitive Disability
In terms of cognitive disability, the demographic groups most similar to Immigrants from Greece are Immigrants from Austria (16.3%, a difference of 0.030%), Lithuanian (16.3%, a difference of 0.090%), Maltese (16.2%, a difference of 0.18%), Eastern European (16.3%, a difference of 0.29%), and Immigrants from North Macedonia (16.3%, a difference of 0.31%).
| Demographics | Rating | Rank | Cognitive Disability |
| Immigrants | Poland | 100.0 /100 | #8 | Exceptional 16.1% |
| Assyrians/Chaldeans/Syriacs | 100.0 /100 | #9 | Exceptional 16.2% |
| Immigrants | Scotland | 100.0 /100 | #10 | Exceptional 16.2% |
| Immigrants | Czechoslovakia | 100.0 /100 | #11 | Exceptional 16.2% |
| Maltese | 100.0 /100 | #12 | Exceptional 16.2% |
| Lithuanians | 100.0 /100 | #13 | Exceptional 16.3% |
| Immigrants | Austria | 100.0 /100 | #14 | Exceptional 16.3% |
| Immigrants | Greece | 100.0 /100 | #15 | Exceptional 16.3% |
| Eastern Europeans | 100.0 /100 | #16 | Exceptional 16.3% |
| Immigrants | North Macedonia | 100.0 /100 | #17 | Exceptional 16.3% |
| Immigrants | Northern Europe | 100.0 /100 | #18 | Exceptional 16.3% |
| Immigrants | Bolivia | 100.0 /100 | #19 | Exceptional 16.3% |
| Bulgarians | 100.0 /100 | #20 | Exceptional 16.3% |
| Immigrants | Cuba | 100.0 /100 | #21 | Exceptional 16.3% |
| Immigrants | South Central Asia | 99.9 /100 | #22 | Exceptional 16.4% |