Immigrants from Vietnam vs Immigrants from Sri Lanka Ambulatory Disability
COMPARE
Immigrants from Vietnam
Immigrants from Sri Lanka
Ambulatory Disability
Ambulatory Disability Comparison
Immigrants from Vietnam
Immigrants from Sri Lanka
5.7%
AMBULATORY DISABILITY
99.3/ 100
METRIC RATING
77th/ 347
METRIC RANK
5.4%
AMBULATORY DISABILITY
100.0/ 100
METRIC RATING
18th/ 347
METRIC RANK
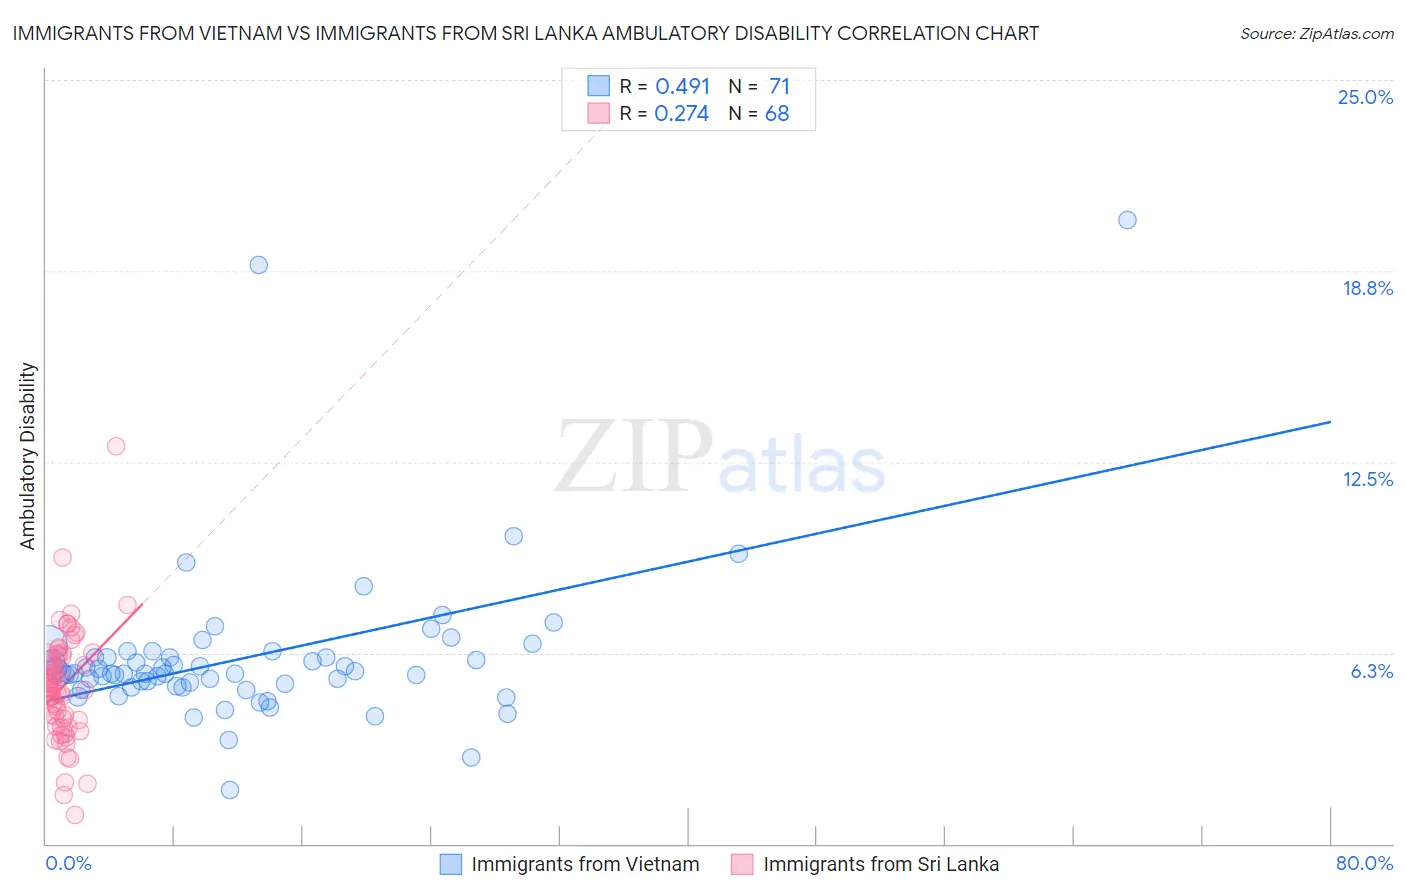
Immigrants from Vietnam vs Immigrants from Sri Lanka Ambulatory Disability Correlation Chart
The statistical analysis conducted on geographies consisting of 404,718,209 people shows a moderate positive correlation between the proportion of Immigrants from Vietnam and percentage of population with ambulatory disability in the United States with a correlation coefficient (R) of 0.491 and weighted average of 5.7%. Similarly, the statistical analysis conducted on geographies consisting of 149,694,852 people shows a weak positive correlation between the proportion of Immigrants from Sri Lanka and percentage of population with ambulatory disability in the United States with a correlation coefficient (R) of 0.274 and weighted average of 5.4%, a difference of 6.8%.
Ambulatory Disability Correlation Summary
| Measurement | Immigrants from Vietnam | Immigrants from Sri Lanka |
| Minimum | 1.8% | 0.94% |
| Maximum | 20.4% | 13.0% |
| Range | 18.7% | 12.1% |
| Mean | 6.1% | 5.2% |
| Median | 5.6% | 5.1% |
| Interquartile 25% (IQ1) | 5.2% | 4.1% |
| Interquartile 75% (IQ3) | 6.1% | 6.2% |
| Interquartile Range (IQR) | 0.95% | 2.1% |
| Standard Deviation (Sample) | 2.7% | 1.8% |
| Standard Deviation (Population) | 2.6% | 1.8% |
Similar Demographics by Ambulatory Disability
Demographics Similar to Immigrants from Vietnam by Ambulatory Disability
In terms of ambulatory disability, the demographic groups most similar to Immigrants from Vietnam are Somali (5.7%, a difference of 0.010%), Chilean (5.7%, a difference of 0.020%), Immigrants from Ireland (5.7%, a difference of 0.15%), Immigrants from Jordan (5.7%, a difference of 0.16%), and Palestinian (5.7%, a difference of 0.16%).
| Demographics | Rating | Rank | Ambulatory Disability |
| Sierra Leoneans | 99.4 /100 | #70 | Exceptional 5.7% |
| Immigrants | Peru | 99.4 /100 | #71 | Exceptional 5.7% |
| Brazilians | 99.4 /100 | #72 | Exceptional 5.7% |
| Immigrants | Northern Africa | 99.4 /100 | #73 | Exceptional 5.7% |
| Immigrants | Cameroon | 99.4 /100 | #74 | Exceptional 5.7% |
| Immigrants | South Africa | 99.3 /100 | #75 | Exceptional 5.7% |
| Sudanese | 99.3 /100 | #76 | Exceptional 5.7% |
| Immigrants | Vietnam | 99.3 /100 | #77 | Exceptional 5.7% |
| Somalis | 99.2 /100 | #78 | Exceptional 5.7% |
| Chileans | 99.2 /100 | #79 | Exceptional 5.7% |
| Immigrants | Ireland | 99.2 /100 | #80 | Exceptional 5.7% |
| Immigrants | Jordan | 99.2 /100 | #81 | Exceptional 5.7% |
| Palestinians | 99.2 /100 | #82 | Exceptional 5.7% |
| Eastern Europeans | 99.2 /100 | #83 | Exceptional 5.7% |
| Ugandans | 99.2 /100 | #84 | Exceptional 5.7% |
Demographics Similar to Immigrants from Sri Lanka by Ambulatory Disability
In terms of ambulatory disability, the demographic groups most similar to Immigrants from Sri Lanka are Immigrants from Ethiopia (5.4%, a difference of 0.010%), Indian (Asian) (5.4%, a difference of 0.10%), Ethiopian (5.4%, a difference of 0.12%), Immigrants from Kuwait (5.4%, a difference of 0.13%), and Immigrants from Hong Kong (5.3%, a difference of 0.34%).
| Demographics | Rating | Rank | Ambulatory Disability |
| Immigrants | Korea | 100.0 /100 | #11 | Exceptional 5.2% |
| Okinawans | 100.0 /100 | #12 | Exceptional 5.3% |
| Burmese | 100.0 /100 | #13 | Exceptional 5.3% |
| Immigrants | Eastern Asia | 100.0 /100 | #14 | Exceptional 5.3% |
| Immigrants | China | 100.0 /100 | #15 | Exceptional 5.3% |
| Immigrants | Hong Kong | 100.0 /100 | #16 | Exceptional 5.3% |
| Immigrants | Ethiopia | 100.0 /100 | #17 | Exceptional 5.4% |
| Immigrants | Sri Lanka | 100.0 /100 | #18 | Exceptional 5.4% |
| Indians (Asian) | 100.0 /100 | #19 | Exceptional 5.4% |
| Ethiopians | 100.0 /100 | #20 | Exceptional 5.4% |
| Immigrants | Kuwait | 100.0 /100 | #21 | Exceptional 5.4% |
| Immigrants | Israel | 100.0 /100 | #22 | Exceptional 5.4% |
| Tongans | 100.0 /100 | #23 | Exceptional 5.4% |
| Immigrants | Saudi Arabia | 100.0 /100 | #24 | Exceptional 5.4% |
| Zimbabweans | 100.0 /100 | #25 | Exceptional 5.4% |