Immigrants from Uzbekistan vs Mexican American Indian Disability Age Over 75
COMPARE
Immigrants from Uzbekistan
Mexican American Indian
Disability Age Over 75
Disability Age Over 75 Comparison
Immigrants from Uzbekistan
Mexican American Indians
49.2%
DISABILITY AGE OVER 75
0.1/ 100
METRIC RATING
276th/ 347
METRIC RANK
50.0%
DISABILITY AGE OVER 75
0.0/ 100
METRIC RATING
296th/ 347
METRIC RANK
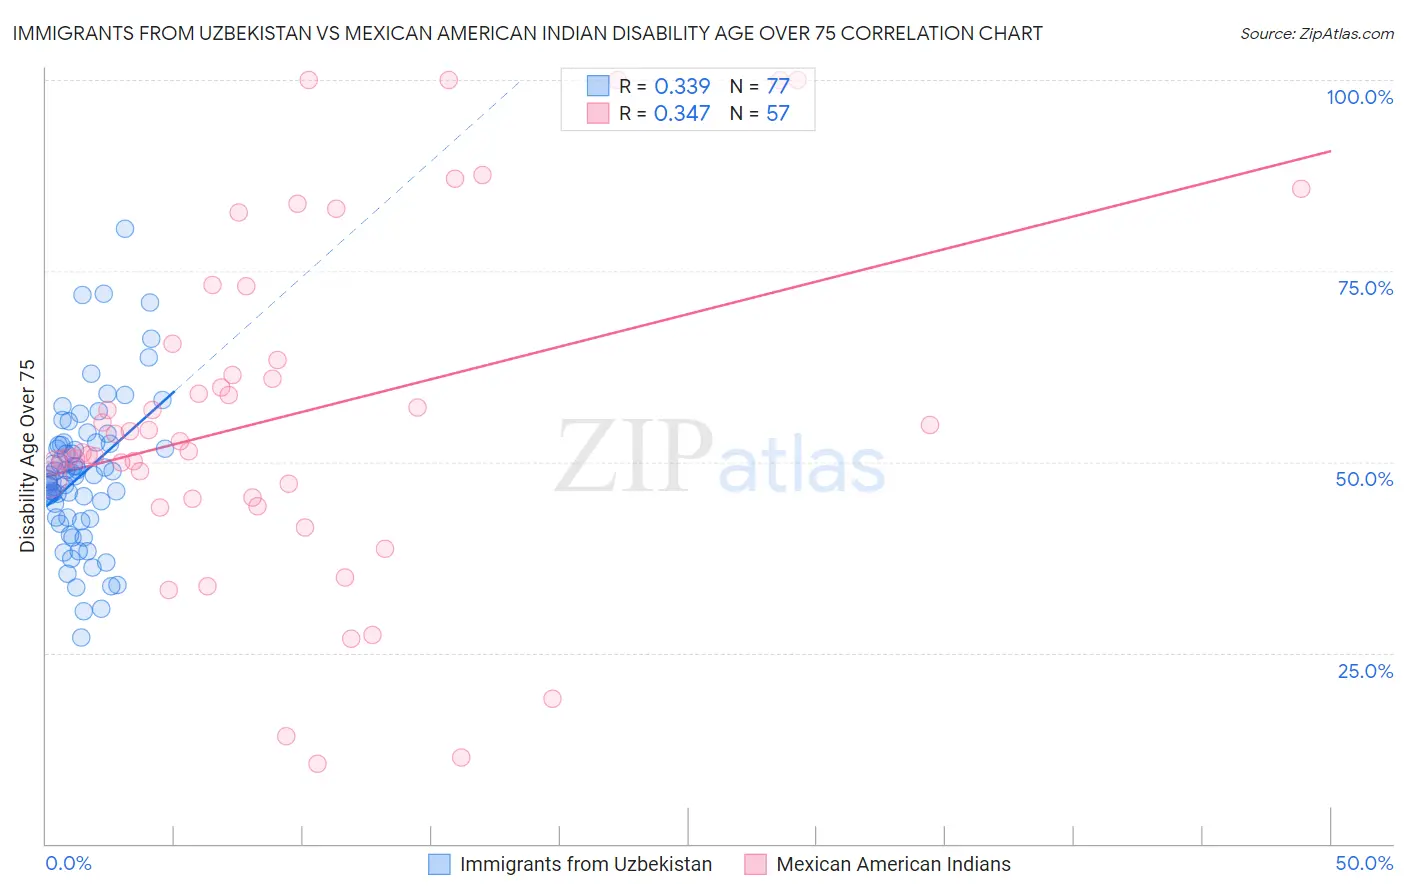
Immigrants from Uzbekistan vs Mexican American Indian Disability Age Over 75 Correlation Chart
The statistical analysis conducted on geographies consisting of 118,571,316 people shows a mild positive correlation between the proportion of Immigrants from Uzbekistan and percentage of population with a disability over the age of 75 in the United States with a correlation coefficient (R) of 0.339 and weighted average of 49.2%. Similarly, the statistical analysis conducted on geographies consisting of 317,150,368 people shows a mild positive correlation between the proportion of Mexican American Indians and percentage of population with a disability over the age of 75 in the United States with a correlation coefficient (R) of 0.347 and weighted average of 50.0%, a difference of 1.7%.
Disability Age Over 75 Correlation Summary
| Measurement | Immigrants from Uzbekistan | Mexican American Indian |
| Minimum | 27.0% | 10.4% |
| Maximum | 80.4% | 100.0% |
| Range | 53.5% | 89.6% |
| Mean | 48.4% | 56.1% |
| Median | 48.2% | 52.7% |
| Interquartile 25% (IQ1) | 42.6% | 45.2% |
| Interquartile 75% (IQ3) | 52.5% | 64.4% |
| Interquartile Range (IQR) | 9.9% | 19.2% |
| Standard Deviation (Sample) | 9.8% | 22.1% |
| Standard Deviation (Population) | 9.7% | 21.9% |
Demographics Similar to Immigrants from Uzbekistan and Mexican American Indians by Disability Age Over 75
In terms of disability age over 75, the demographic groups most similar to Immigrants from Uzbekistan are Hawaiian (49.2%, a difference of 0.020%), Immigrants from Laos (49.2%, a difference of 0.060%), Guamanian/Chamorro (49.4%, a difference of 0.44%), Bangladeshi (49.4%, a difference of 0.50%), and Belizean (49.4%, a difference of 0.51%). Similarly, the demographic groups most similar to Mexican American Indians are Spanish American (50.0%, a difference of 0.040%), Immigrants from Cambodia (50.0%, a difference of 0.080%), Spanish American Indian (49.9%, a difference of 0.19%), Shoshone (49.9%, a difference of 0.35%), and Puget Sound Salish (49.8%, a difference of 0.42%).
| Demographics | Rating | Rank | Disability Age Over 75 |
| Immigrants | Uzbekistan | 0.1 /100 | #276 | Tragic 49.2% |
| Hawaiians | 0.1 /100 | #277 | Tragic 49.2% |
| Immigrants | Laos | 0.1 /100 | #278 | Tragic 49.2% |
| Guamanians/Chamorros | 0.0 /100 | #279 | Tragic 49.4% |
| Bangladeshis | 0.0 /100 | #280 | Tragic 49.4% |
| Belizeans | 0.0 /100 | #281 | Tragic 49.4% |
| Blacks/African Americans | 0.0 /100 | #282 | Tragic 49.5% |
| Samoans | 0.0 /100 | #283 | Tragic 49.5% |
| Immigrants | Latin America | 0.0 /100 | #284 | Tragic 49.5% |
| Crow | 0.0 /100 | #285 | Tragic 49.6% |
| Immigrants | Belize | 0.0 /100 | #286 | Tragic 49.6% |
| Sioux | 0.0 /100 | #287 | Tragic 49.7% |
| Yaqui | 0.0 /100 | #288 | Tragic 49.8% |
| Osage | 0.0 /100 | #289 | Tragic 49.8% |
| Puget Sound Salish | 0.0 /100 | #290 | Tragic 49.8% |
| Arapaho | 0.0 /100 | #291 | Tragic 49.8% |
| Shoshone | 0.0 /100 | #292 | Tragic 49.9% |
| Spanish American Indians | 0.0 /100 | #293 | Tragic 49.9% |
| Immigrants | Cambodia | 0.0 /100 | #294 | Tragic 50.0% |
| Spanish Americans | 0.0 /100 | #295 | Tragic 50.0% |
| Mexican American Indians | 0.0 /100 | #296 | Tragic 50.0% |