Immigrants from Trinidad and Tobago vs Ute Female Disability
COMPARE
Immigrants from Trinidad and Tobago
Ute
Female Disability
Female Disability Comparison
Immigrants from Trinidad and Tobago
Ute
12.3%
FEMALE DISABILITY
24.7/ 100
METRIC RATING
199th/ 347
METRIC RANK
12.4%
FEMALE DISABILITY
14.7/ 100
METRIC RATING
212th/ 347
METRIC RANK
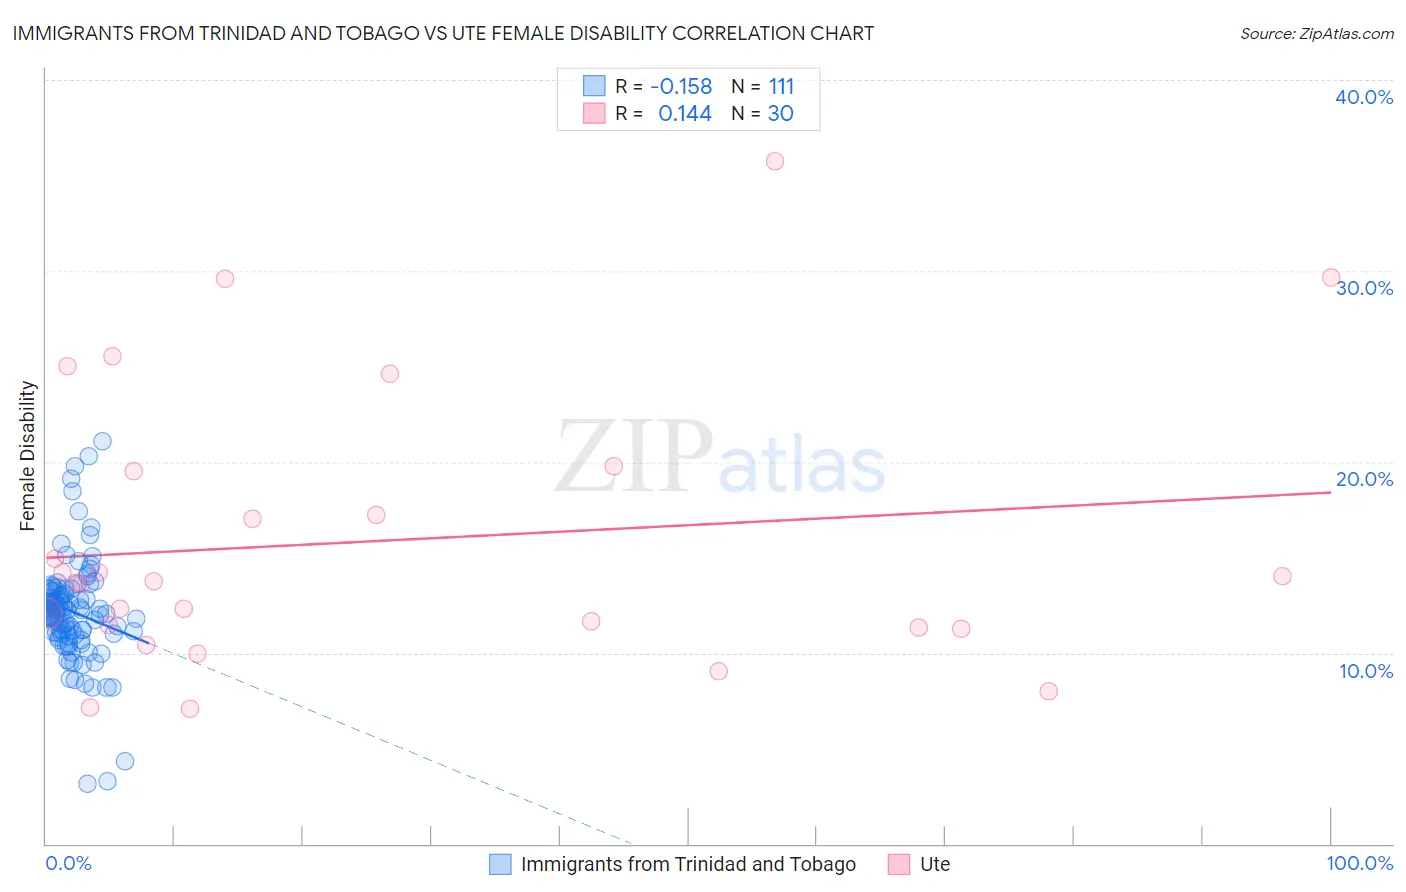
Immigrants from Trinidad and Tobago vs Ute Female Disability Correlation Chart
The statistical analysis conducted on geographies consisting of 223,503,313 people shows a poor negative correlation between the proportion of Immigrants from Trinidad and Tobago and percentage of females with a disability in the United States with a correlation coefficient (R) of -0.158 and weighted average of 12.3%. Similarly, the statistical analysis conducted on geographies consisting of 55,657,679 people shows a poor positive correlation between the proportion of Ute and percentage of females with a disability in the United States with a correlation coefficient (R) of 0.144 and weighted average of 12.4%, a difference of 0.60%.
Female Disability Correlation Summary
| Measurement | Immigrants from Trinidad and Tobago | Ute |
| Minimum | 3.2% | 7.1% |
| Maximum | 21.1% | 35.7% |
| Range | 17.9% | 28.7% |
| Mean | 12.1% | 15.9% |
| Median | 12.1% | 13.7% |
| Interquartile 25% (IQ1) | 11.0% | 11.3% |
| Interquartile 75% (IQ3) | 13.2% | 19.5% |
| Interquartile Range (IQR) | 2.3% | 8.2% |
| Standard Deviation (Sample) | 2.8% | 7.3% |
| Standard Deviation (Population) | 2.7% | 7.1% |
Demographics Similar to Immigrants from Trinidad and Tobago and Ute by Female Disability
In terms of female disability, the demographic groups most similar to Immigrants from Trinidad and Tobago are Mexican American Indian (12.3%, a difference of 0.010%), Immigrants from Panama (12.3%, a difference of 0.040%), Honduran (12.3%, a difference of 0.040%), Swedish (12.3%, a difference of 0.10%), and Trinidadian and Tobagonian (12.3%, a difference of 0.12%). Similarly, the demographic groups most similar to Ute are Swiss (12.4%, a difference of 0.010%), Immigrants from Bosnia and Herzegovina (12.4%, a difference of 0.010%), Immigrants from Thailand (12.4%, a difference of 0.020%), Mexican (12.4%, a difference of 0.070%), and Panamanian (12.4%, a difference of 0.10%).
| Demographics | Rating | Rank | Female Disability |
| Swedes | 26.6 /100 | #195 | Fair 12.3% |
| Immigrants | Panama | 25.5 /100 | #196 | Fair 12.3% |
| Hondurans | 25.4 /100 | #197 | Fair 12.3% |
| Mexican American Indians | 24.9 /100 | #198 | Fair 12.3% |
| Immigrants | Trinidad and Tobago | 24.7 /100 | #199 | Fair 12.3% |
| Trinidadians and Tobagonians | 22.4 /100 | #200 | Fair 12.3% |
| Chinese | 22.1 /100 | #201 | Fair 12.3% |
| Somalis | 21.5 /100 | #202 | Fair 12.3% |
| Immigrants | Barbados | 21.1 /100 | #203 | Fair 12.3% |
| Immigrants | Zaire | 20.9 /100 | #204 | Fair 12.3% |
| Immigrants | Grenada | 20.5 /100 | #205 | Fair 12.4% |
| Immigrants | Cuba | 20.2 /100 | #206 | Fair 12.4% |
| Croatians | 20.2 /100 | #207 | Fair 12.4% |
| Basques | 17.5 /100 | #208 | Poor 12.4% |
| Mexicans | 15.7 /100 | #209 | Poor 12.4% |
| Swiss | 14.9 /100 | #210 | Poor 12.4% |
| Immigrants | Bosnia and Herzegovina | 14.8 /100 | #211 | Poor 12.4% |
| Ute | 14.7 /100 | #212 | Poor 12.4% |
| Immigrants | Thailand | 14.5 /100 | #213 | Poor 12.4% |
| Panamanians | 13.5 /100 | #214 | Poor 12.4% |
| Samoans | 13.4 /100 | #215 | Poor 12.4% |