Immigrants from Fiji vs Osage Ambulatory Disability
COMPARE
Immigrants from Fiji
Osage
Ambulatory Disability
Ambulatory Disability Comparison
Immigrants from Fiji
Osage
6.0%
AMBULATORY DISABILITY
71.2/ 100
METRIC RATING
158th/ 347
METRIC RANK
7.4%
AMBULATORY DISABILITY
0.0/ 100
METRIC RATING
322nd/ 347
METRIC RANK
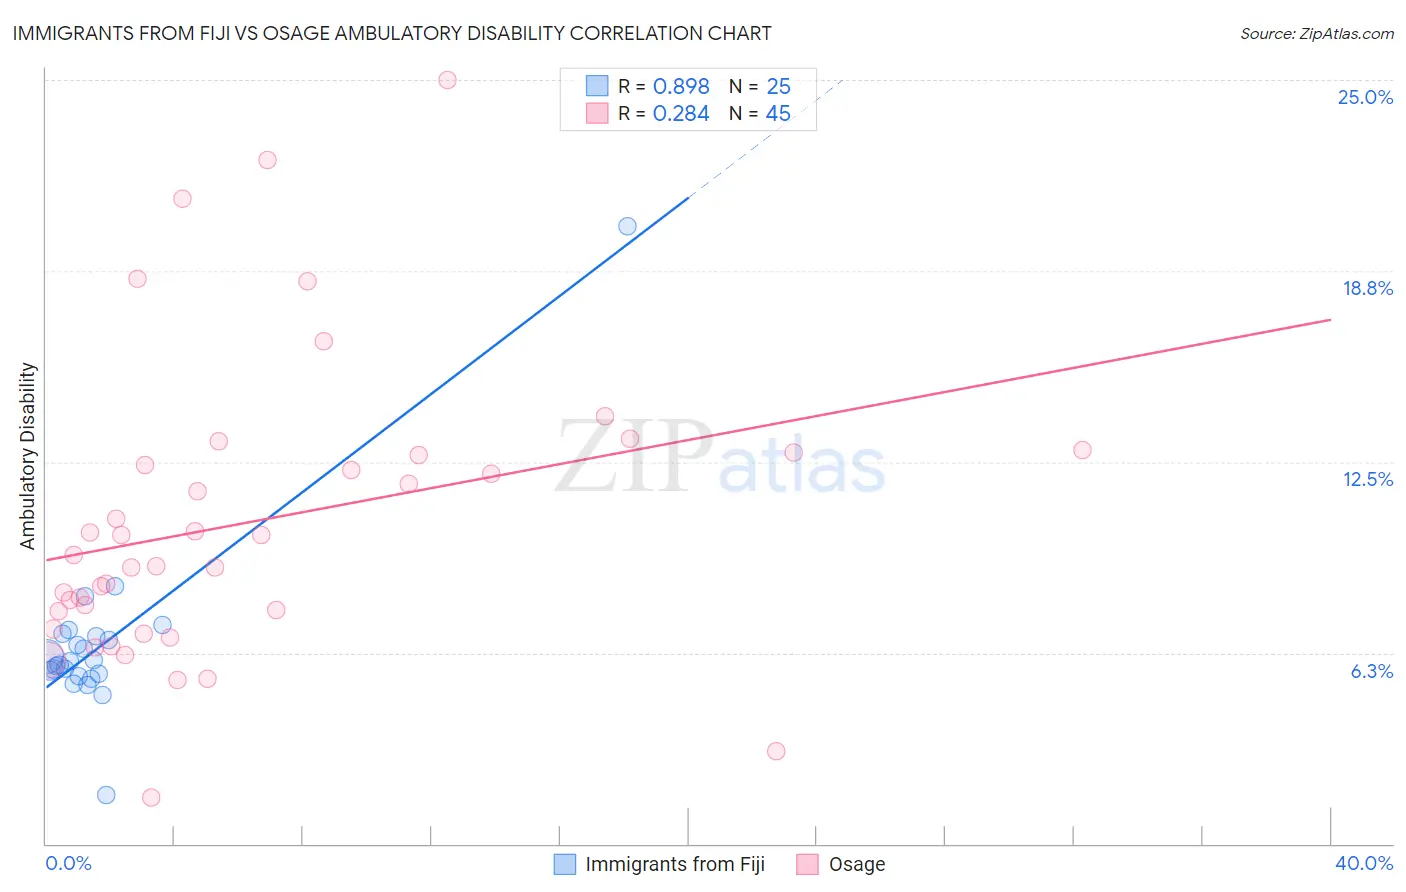
Immigrants from Fiji vs Osage Ambulatory Disability Correlation Chart
The statistical analysis conducted on geographies consisting of 93,755,380 people shows a very strong positive correlation between the proportion of Immigrants from Fiji and percentage of population with ambulatory disability in the United States with a correlation coefficient (R) of 0.898 and weighted average of 6.0%. Similarly, the statistical analysis conducted on geographies consisting of 91,795,743 people shows a weak positive correlation between the proportion of Osage and percentage of population with ambulatory disability in the United States with a correlation coefficient (R) of 0.284 and weighted average of 7.4%, a difference of 22.2%.
Ambulatory Disability Correlation Summary
| Measurement | Immigrants from Fiji | Osage |
| Minimum | 1.6% | 1.5% |
| Maximum | 20.2% | 25.0% |
| Range | 18.6% | 23.5% |
| Mean | 6.6% | 10.5% |
| Median | 6.0% | 9.5% |
| Interquartile 25% (IQ1) | 5.5% | 7.3% |
| Interquartile 75% (IQ3) | 6.8% | 12.8% |
| Interquartile Range (IQR) | 1.3% | 5.5% |
| Standard Deviation (Sample) | 3.1% | 4.9% |
| Standard Deviation (Population) | 3.0% | 4.8% |
Similar Demographics by Ambulatory Disability
Demographics Similar to Immigrants from Fiji by Ambulatory Disability
In terms of ambulatory disability, the demographic groups most similar to Immigrants from Fiji are Ghanaian (6.0%, a difference of 0.010%), Immigrants from Latvia (6.0%, a difference of 0.010%), Northern European (6.0%, a difference of 0.050%), Immigrants from Scotland (6.0%, a difference of 0.070%), and Central American (6.0%, a difference of 0.080%).
| Demographics | Rating | Rank | Ambulatory Disability |
| Greeks | 79.6 /100 | #151 | Good 6.0% |
| Immigrants | Austria | 78.8 /100 | #152 | Good 6.0% |
| Syrians | 75.5 /100 | #153 | Good 6.0% |
| Immigrants | Croatia | 75.1 /100 | #154 | Good 6.0% |
| Immigrants | Scotland | 72.1 /100 | #155 | Good 6.0% |
| Northern Europeans | 71.8 /100 | #156 | Good 6.0% |
| Ghanaians | 71.3 /100 | #157 | Good 6.0% |
| Immigrants | Fiji | 71.2 /100 | #158 | Good 6.0% |
| Immigrants | Latvia | 71.1 /100 | #159 | Good 6.0% |
| Central Americans | 69.8 /100 | #160 | Good 6.0% |
| Immigrants | Belarus | 69.2 /100 | #161 | Good 6.1% |
| Nigerians | 67.1 /100 | #162 | Good 6.1% |
| Lebanese | 66.2 /100 | #163 | Good 6.1% |
| Basques | 63.7 /100 | #164 | Good 6.1% |
| Nicaraguans | 63.2 /100 | #165 | Good 6.1% |
Demographics Similar to Osage by Ambulatory Disability
In terms of ambulatory disability, the demographic groups most similar to Osage are Apache (7.4%, a difference of 0.14%), American (7.4%, a difference of 0.28%), Potawatomi (7.3%, a difference of 0.95%), Navajo (7.5%, a difference of 1.6%), and Comanche (7.5%, a difference of 1.7%).
| Demographics | Rating | Rank | Ambulatory Disability |
| Shoshone | 0.0 /100 | #315 | Tragic 7.1% |
| Immigrants | Dominican Republic | 0.0 /100 | #316 | Tragic 7.1% |
| Central American Indians | 0.0 /100 | #317 | Tragic 7.2% |
| Ottawa | 0.0 /100 | #318 | Tragic 7.2% |
| Dominicans | 0.0 /100 | #319 | Tragic 7.2% |
| Potawatomi | 0.0 /100 | #320 | Tragic 7.3% |
| Apache | 0.0 /100 | #321 | Tragic 7.4% |
| Osage | 0.0 /100 | #322 | Tragic 7.4% |
| Americans | 0.0 /100 | #323 | Tragic 7.4% |
| Navajo | 0.0 /100 | #324 | Tragic 7.5% |
| Comanche | 0.0 /100 | #325 | Tragic 7.5% |
| Blacks/African Americans | 0.0 /100 | #326 | Tragic 7.5% |
| Natives/Alaskans | 0.0 /100 | #327 | Tragic 7.5% |
| Hopi | 0.0 /100 | #328 | Tragic 7.6% |
| Pueblo | 0.0 /100 | #329 | Tragic 7.6% |