Colville vs Osage Ambulatory Disability
COMPARE
Colville
Osage
Ambulatory Disability
Ambulatory Disability Comparison
Colville
Osage
8.2%
AMBULATORY DISABILITY
0.0/ 100
METRIC RATING
338th/ 347
METRIC RANK
7.4%
AMBULATORY DISABILITY
0.0/ 100
METRIC RATING
322nd/ 347
METRIC RANK
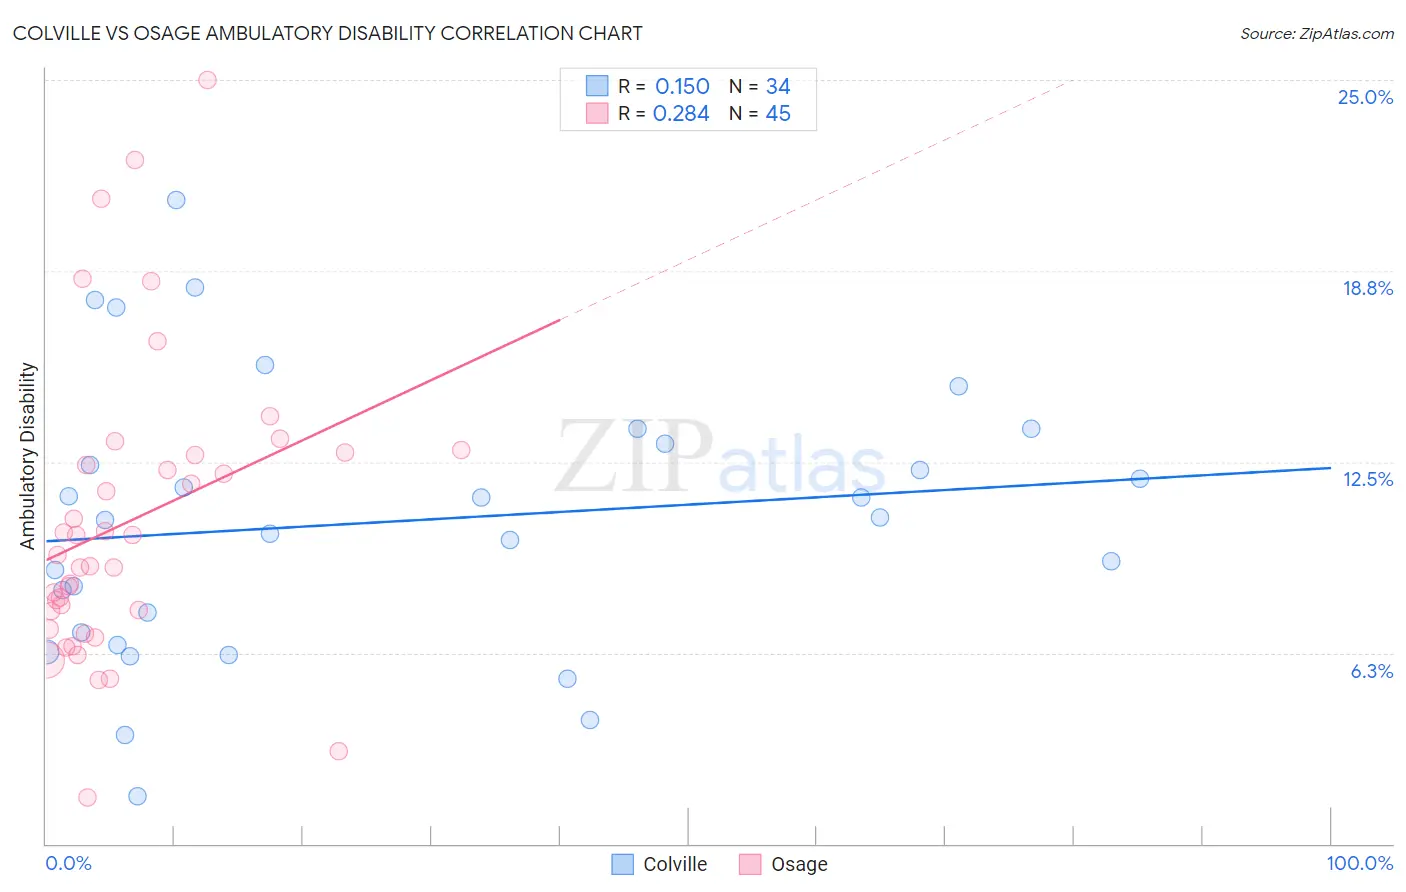
Colville vs Osage Ambulatory Disability Correlation Chart
The statistical analysis conducted on geographies consisting of 34,678,194 people shows a poor positive correlation between the proportion of Colville and percentage of population with ambulatory disability in the United States with a correlation coefficient (R) of 0.150 and weighted average of 8.2%. Similarly, the statistical analysis conducted on geographies consisting of 91,795,743 people shows a weak positive correlation between the proportion of Osage and percentage of population with ambulatory disability in the United States with a correlation coefficient (R) of 0.284 and weighted average of 7.4%, a difference of 11.2%.
Ambulatory Disability Correlation Summary
| Measurement | Colville | Osage |
| Minimum | 1.6% | 1.5% |
| Maximum | 21.1% | 25.0% |
| Range | 19.5% | 23.5% |
| Mean | 10.5% | 10.5% |
| Median | 10.6% | 9.5% |
| Interquartile 25% (IQ1) | 6.9% | 7.3% |
| Interquartile 75% (IQ3) | 13.1% | 12.8% |
| Interquartile Range (IQR) | 6.2% | 5.5% |
| Standard Deviation (Sample) | 4.5% | 4.9% |
| Standard Deviation (Population) | 4.4% | 4.8% |
Demographics Similar to Colville and Osage by Ambulatory Disability
In terms of ambulatory disability, the demographic groups most similar to Colville are Pima (8.2%, a difference of 0.35%), Dutch West Indian (8.2%, a difference of 0.57%), Choctaw (8.3%, a difference of 1.2%), Seminole (8.0%, a difference of 2.2%), and Chickasaw (8.0%, a difference of 2.3%). Similarly, the demographic groups most similar to Osage are Apache (7.4%, a difference of 0.14%), American (7.4%, a difference of 0.28%), Potawatomi (7.3%, a difference of 0.95%), Navajo (7.5%, a difference of 1.6%), and Comanche (7.5%, a difference of 1.7%).
| Demographics | Rating | Rank | Ambulatory Disability |
| Potawatomi | 0.0 /100 | #320 | Tragic 7.3% |
| Apache | 0.0 /100 | #321 | Tragic 7.4% |
| Osage | 0.0 /100 | #322 | Tragic 7.4% |
| Americans | 0.0 /100 | #323 | Tragic 7.4% |
| Navajo | 0.0 /100 | #324 | Tragic 7.5% |
| Comanche | 0.0 /100 | #325 | Tragic 7.5% |
| Blacks/African Americans | 0.0 /100 | #326 | Tragic 7.5% |
| Natives/Alaskans | 0.0 /100 | #327 | Tragic 7.5% |
| Hopi | 0.0 /100 | #328 | Tragic 7.6% |
| Pueblo | 0.0 /100 | #329 | Tragic 7.6% |
| Paiute | 0.0 /100 | #330 | Tragic 7.7% |
| Cajuns | 0.0 /100 | #331 | Tragic 7.8% |
| Menominee | 0.0 /100 | #332 | Tragic 7.8% |
| Cherokee | 0.0 /100 | #333 | Tragic 7.9% |
| Yuman | 0.0 /100 | #334 | Tragic 7.9% |
| Chickasaw | 0.0 /100 | #335 | Tragic 8.0% |
| Seminole | 0.0 /100 | #336 | Tragic 8.0% |
| Dutch West Indians | 0.0 /100 | #337 | Tragic 8.2% |
| Colville | 0.0 /100 | #338 | Tragic 8.2% |
| Pima | 0.0 /100 | #339 | Tragic 8.2% |
| Choctaw | 0.0 /100 | #340 | Tragic 8.3% |