Sierra Leonean vs Immigrants from India Male Disability
COMPARE
Sierra Leonean
Immigrants from India
Male Disability
Male Disability Comparison
Sierra Leoneans
Immigrants from India
10.5%
MALE DISABILITY
98.7/ 100
METRIC RATING
75th/ 347
METRIC RANK
9.0%
MALE DISABILITY
100.0/ 100
METRIC RATING
1st/ 347
METRIC RANK
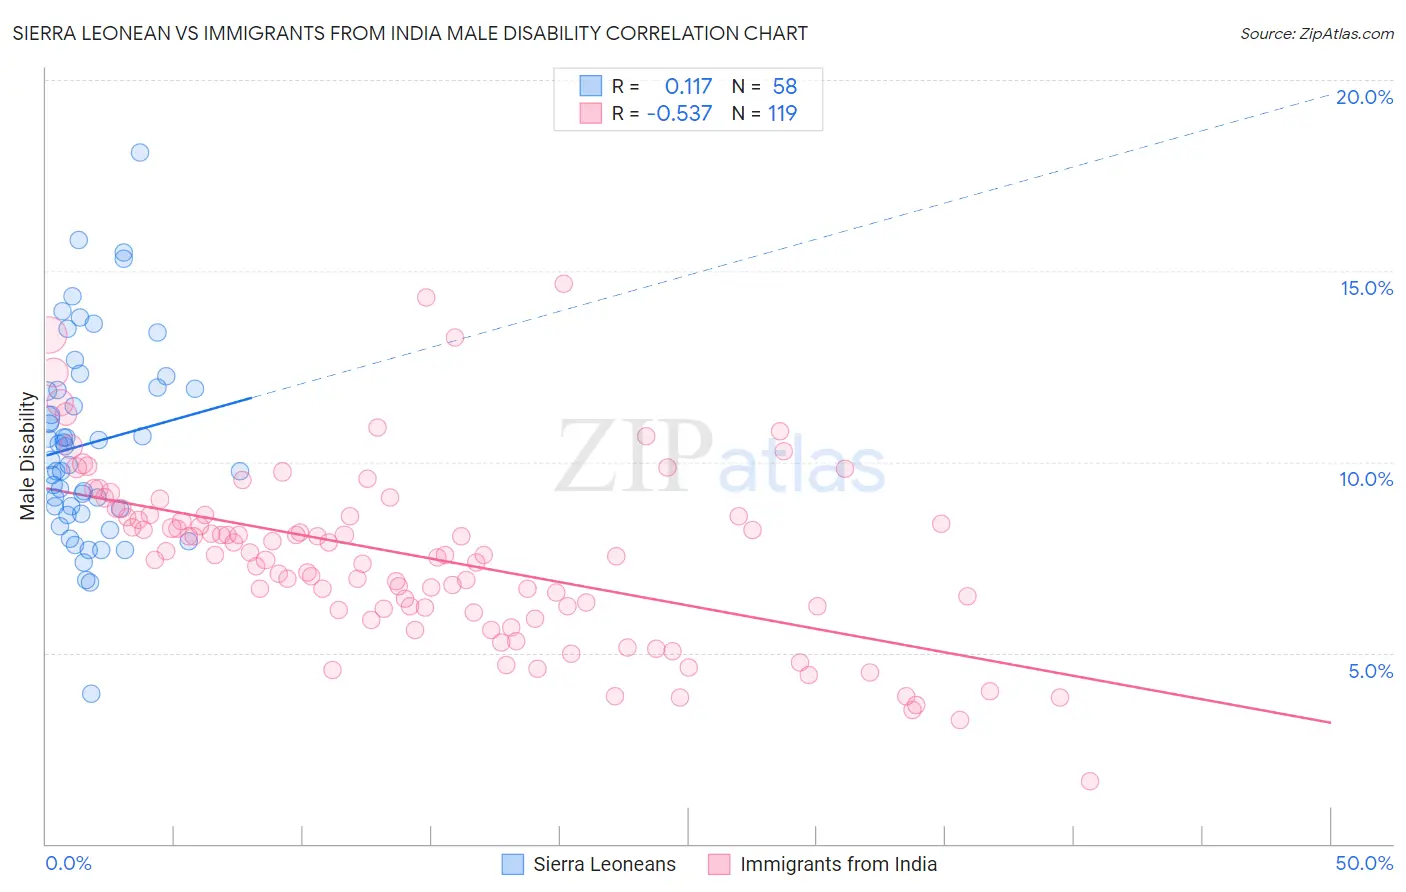
Sierra Leonean vs Immigrants from India Male Disability Correlation Chart
The statistical analysis conducted on geographies consisting of 83,361,010 people shows a poor positive correlation between the proportion of Sierra Leoneans and percentage of males with a disability in the United States with a correlation coefficient (R) of 0.117 and weighted average of 10.5%. Similarly, the statistical analysis conducted on geographies consisting of 434,062,130 people shows a substantial negative correlation between the proportion of Immigrants from India and percentage of males with a disability in the United States with a correlation coefficient (R) of -0.537 and weighted average of 9.0%, a difference of 16.7%.
Male Disability Correlation Summary
| Measurement | Sierra Leonean | Immigrants from India |
| Minimum | 3.9% | 1.6% |
| Maximum | 18.1% | 14.7% |
| Range | 14.2% | 13.0% |
| Mean | 10.5% | 7.5% |
| Median | 10.2% | 7.6% |
| Interquartile 25% (IQ1) | 8.8% | 6.2% |
| Interquartile 75% (IQ3) | 11.9% | 8.6% |
| Interquartile Range (IQR) | 3.2% | 2.5% |
| Standard Deviation (Sample) | 2.6% | 2.3% |
| Standard Deviation (Population) | 2.6% | 2.3% |
Similar Demographics by Male Disability
Demographics Similar to Sierra Leoneans by Male Disability
In terms of male disability, the demographic groups most similar to Sierra Leoneans are Immigrants from Sierra Leone (10.5%, a difference of 0.040%), Laotian (10.6%, a difference of 0.10%), Immigrants from Lebanon (10.5%, a difference of 0.12%), Immigrants from Russia (10.6%, a difference of 0.12%), and Immigrants from Lithuania (10.5%, a difference of 0.26%).
| Demographics | Rating | Rank | Male Disability |
| Colombians | 99.2 /100 | #68 | Exceptional 10.5% |
| Ecuadorians | 99.2 /100 | #69 | Exceptional 10.5% |
| Immigrants | Bulgaria | 99.1 /100 | #70 | Exceptional 10.5% |
| Immigrants | Cameroon | 99.0 /100 | #71 | Exceptional 10.5% |
| Immigrants | Serbia | 99.0 /100 | #72 | Exceptional 10.5% |
| Immigrants | Lithuania | 98.9 /100 | #73 | Exceptional 10.5% |
| Immigrants | Lebanon | 98.8 /100 | #74 | Exceptional 10.5% |
| Sierra Leoneans | 98.7 /100 | #75 | Exceptional 10.5% |
| Immigrants | Sierra Leone | 98.7 /100 | #76 | Exceptional 10.5% |
| Laotians | 98.6 /100 | #77 | Exceptional 10.6% |
| Immigrants | Russia | 98.6 /100 | #78 | Exceptional 10.6% |
| Zimbabweans | 98.4 /100 | #79 | Exceptional 10.6% |
| Immigrants | Jordan | 98.4 /100 | #80 | Exceptional 10.6% |
| Immigrants | Chile | 98.3 /100 | #81 | Exceptional 10.6% |
| Immigrants | Guyana | 98.2 /100 | #82 | Exceptional 10.6% |
Demographics Similar to Immigrants from India by Male Disability
In terms of male disability, the demographic groups most similar to Immigrants from India are Immigrants from Taiwan (9.1%, a difference of 0.89%), Filipino (9.1%, a difference of 0.90%), Thai (9.2%, a difference of 2.2%), Immigrants from Hong Kong (9.4%, a difference of 4.4%), and Immigrants from South Central Asia (9.4%, a difference of 4.4%).
| Demographics | Rating | Rank | Male Disability |
| Immigrants | India | 100.0 /100 | #1 | Exceptional 9.0% |
| Immigrants | Taiwan | 100.0 /100 | #2 | Exceptional 9.1% |
| Filipinos | 100.0 /100 | #3 | Exceptional 9.1% |
| Thais | 100.0 /100 | #4 | Exceptional 9.2% |
| Immigrants | Hong Kong | 100.0 /100 | #5 | Exceptional 9.4% |
| Immigrants | South Central Asia | 100.0 /100 | #6 | Exceptional 9.4% |
| Immigrants | Bolivia | 100.0 /100 | #7 | Exceptional 9.5% |
| Immigrants | China | 100.0 /100 | #8 | Exceptional 9.5% |
| Immigrants | Singapore | 100.0 /100 | #9 | Exceptional 9.5% |
| Immigrants | Israel | 100.0 /100 | #10 | Exceptional 9.6% |
| Immigrants | Eastern Asia | 100.0 /100 | #11 | Exceptional 9.6% |
| Bolivians | 100.0 /100 | #12 | Exceptional 9.6% |
| Iranians | 100.0 /100 | #13 | Exceptional 9.7% |
| Immigrants | Iran | 100.0 /100 | #14 | Exceptional 9.7% |
| Indians (Asian) | 100.0 /100 | #15 | Exceptional 9.7% |