Immigrants from Sudan vs Portuguese Disability Age 35 to 64
COMPARE
Immigrants from Sudan
Portuguese
Disability Age 35 to 64
Disability Age 35 to 64 Comparison
Immigrants from Sudan
Portuguese
11.7%
DISABILITY AGE 35 TO 64
11.4/ 100
METRIC RATING
214th/ 347
METRIC RANK
11.9%
DISABILITY AGE 35 TO 64
4.9/ 100
METRIC RATING
234th/ 347
METRIC RANK
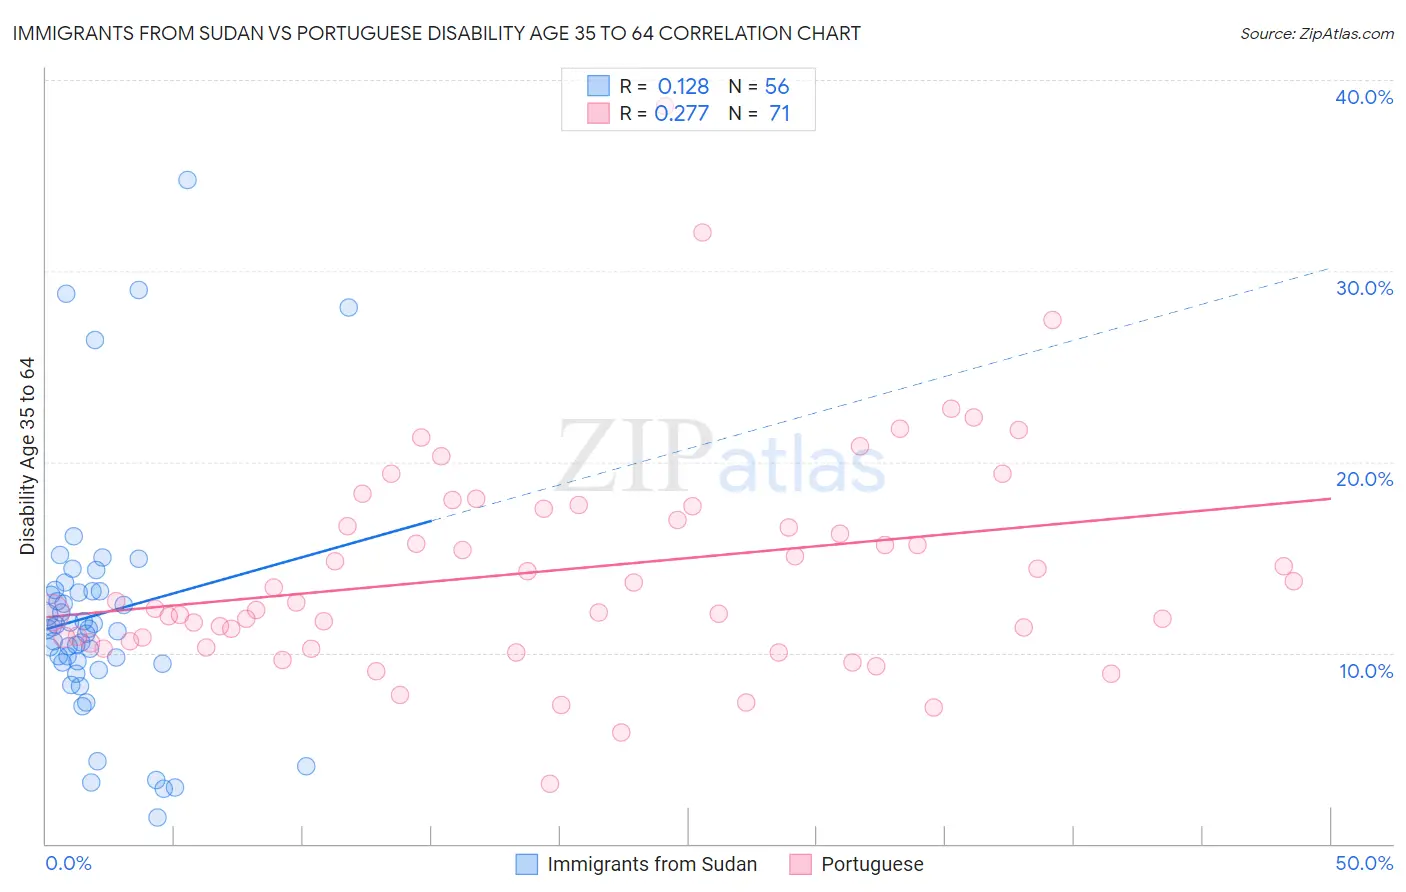
Immigrants from Sudan vs Portuguese Disability Age 35 to 64 Correlation Chart
The statistical analysis conducted on geographies consisting of 118,946,104 people shows a poor positive correlation between the proportion of Immigrants from Sudan and percentage of population with a disability between the ages 34 and 64 in the United States with a correlation coefficient (R) of 0.128 and weighted average of 11.7%. Similarly, the statistical analysis conducted on geographies consisting of 449,875,842 people shows a weak positive correlation between the proportion of Portuguese and percentage of population with a disability between the ages 34 and 64 in the United States with a correlation coefficient (R) of 0.277 and weighted average of 11.9%, a difference of 1.8%.
Disability Age 35 to 64 Correlation Summary
| Measurement | Immigrants from Sudan | Portuguese |
| Minimum | 1.4% | 3.1% |
| Maximum | 34.7% | 38.6% |
| Range | 33.4% | 35.5% |
| Mean | 12.0% | 14.3% |
| Median | 11.3% | 12.7% |
| Interquartile 25% (IQ1) | 9.5% | 10.6% |
| Interquartile 75% (IQ3) | 13.2% | 17.6% |
| Interquartile Range (IQR) | 3.7% | 7.0% |
| Standard Deviation (Sample) | 6.5% | 5.8% |
| Standard Deviation (Population) | 6.4% | 5.8% |
Demographics Similar to Immigrants from Sudan and Portuguese by Disability Age 35 to 64
In terms of disability age 35 to 64, the demographic groups most similar to Immigrants from Sudan are Spanish American Indian (11.7%, a difference of 0.050%), Bahamian (11.8%, a difference of 0.14%), Barbadian (11.8%, a difference of 0.40%), Immigrants from Bahamas (11.8%, a difference of 0.46%), and Czechoslovakian (11.8%, a difference of 0.50%). Similarly, the demographic groups most similar to Portuguese are Bermudan (11.9%, a difference of 0.070%), Sudanese (11.9%, a difference of 0.18%), Jamaican (11.9%, a difference of 0.32%), Panamanian (11.9%, a difference of 0.35%), and British West Indian (11.9%, a difference of 0.45%).
| Demographics | Rating | Rank | Disability Age 35 to 64 |
| Immigrants | Sudan | 11.4 /100 | #214 | Poor 11.7% |
| Spanish American Indians | 11.1 /100 | #215 | Poor 11.7% |
| Bahamians | 10.7 /100 | #216 | Poor 11.8% |
| Barbadians | 9.5 /100 | #217 | Tragic 11.8% |
| Immigrants | Bahamas | 9.2 /100 | #218 | Tragic 11.8% |
| Czechoslovakians | 9.0 /100 | #219 | Tragic 11.8% |
| Immigrants | West Indies | 8.9 /100 | #220 | Tragic 11.8% |
| Alsatians | 8.5 /100 | #221 | Tragic 11.8% |
| Hondurans | 8.4 /100 | #222 | Tragic 11.8% |
| Immigrants | Honduras | 8.4 /100 | #223 | Tragic 11.8% |
| Immigrants | Ghana | 7.8 /100 | #224 | Tragic 11.8% |
| Immigrants | Belize | 6.6 /100 | #225 | Tragic 11.9% |
| Scandinavians | 6.4 /100 | #226 | Tragic 11.9% |
| Immigrants | Central America | 6.3 /100 | #227 | Tragic 11.9% |
| Immigrants | Germany | 6.2 /100 | #228 | Tragic 11.9% |
| British West Indians | 6.1 /100 | #229 | Tragic 11.9% |
| Panamanians | 5.8 /100 | #230 | Tragic 11.9% |
| Jamaicans | 5.7 /100 | #231 | Tragic 11.9% |
| Sudanese | 5.3 /100 | #232 | Tragic 11.9% |
| Bermudans | 5.0 /100 | #233 | Tragic 11.9% |
| Portuguese | 4.9 /100 | #234 | Tragic 11.9% |