Dutch West Indian vs Immigrants from Bolivia Disability Age 65 to 74
COMPARE
Dutch West Indian
Immigrants from Bolivia
Disability Age 65 to 74
Disability Age 65 to 74 Comparison
Dutch West Indians
Immigrants from Bolivia
29.6%
DISABILITY AGE 65 TO 74
0.0/ 100
METRIC RATING
325th/ 347
METRIC RANK
20.8%
DISABILITY AGE 65 TO 74
99.9/ 100
METRIC RATING
21st/ 347
METRIC RANK
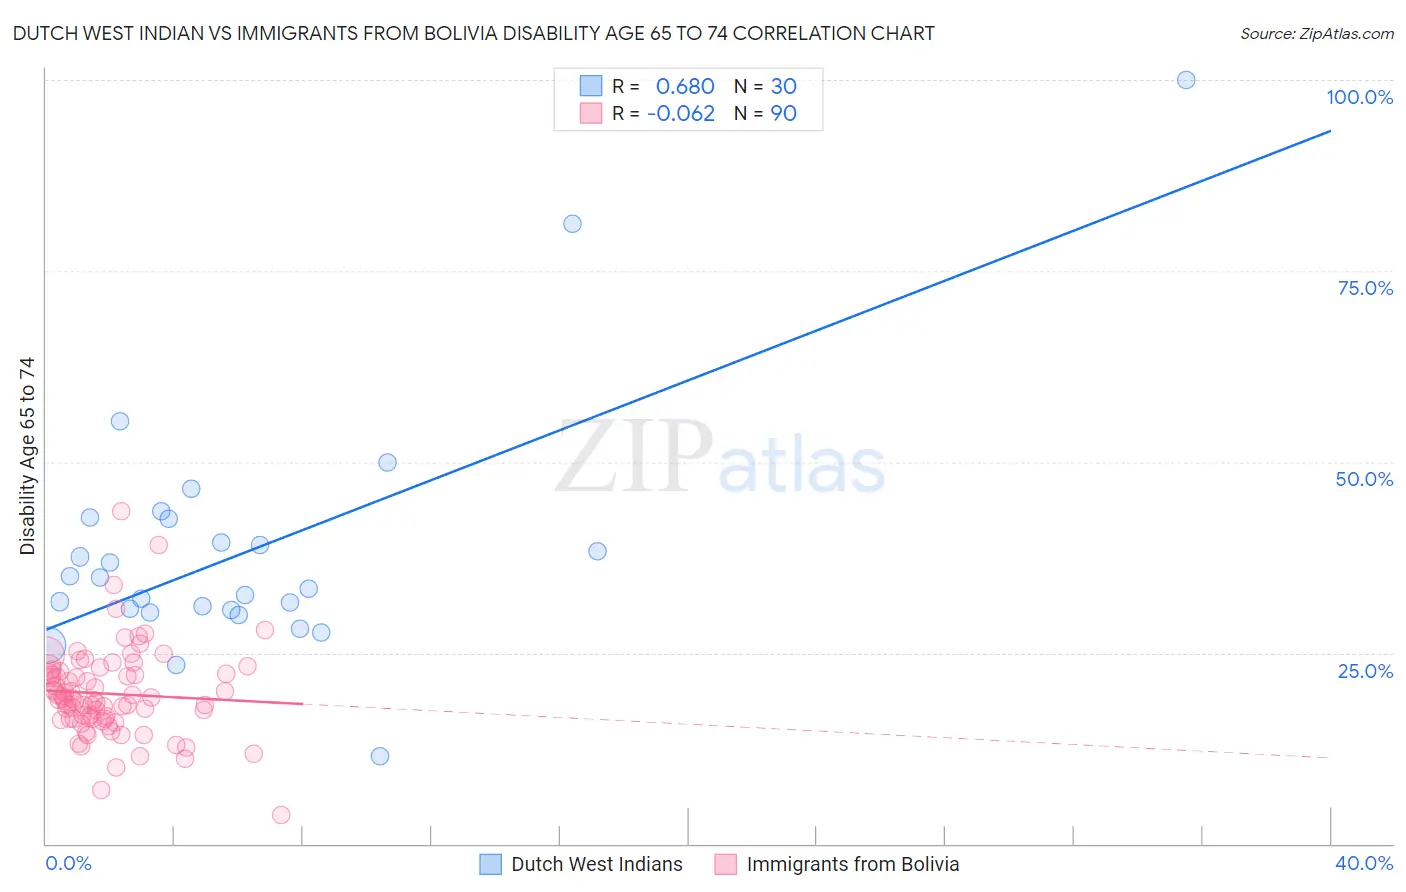
Dutch West Indian vs Immigrants from Bolivia Disability Age 65 to 74 Correlation Chart
The statistical analysis conducted on geographies consisting of 85,748,630 people shows a significant positive correlation between the proportion of Dutch West Indians and percentage of population with a disability between the ages 65 and 75 in the United States with a correlation coefficient (R) of 0.680 and weighted average of 29.6%. Similarly, the statistical analysis conducted on geographies consisting of 158,677,303 people shows a slight negative correlation between the proportion of Immigrants from Bolivia and percentage of population with a disability between the ages 65 and 75 in the United States with a correlation coefficient (R) of -0.062 and weighted average of 20.8%, a difference of 41.8%.
Disability Age 65 to 74 Correlation Summary
| Measurement | Dutch West Indian | Immigrants from Bolivia |
| Minimum | 11.5% | 3.8% |
| Maximum | 100.0% | 43.5% |
| Range | 88.5% | 39.7% |
| Mean | 38.5% | 19.6% |
| Median | 34.1% | 18.9% |
| Interquartile 25% (IQ1) | 30.5% | 16.4% |
| Interquartile 75% (IQ3) | 42.5% | 22.2% |
| Interquartile Range (IQR) | 12.0% | 5.9% |
| Standard Deviation (Sample) | 16.6% | 5.9% |
| Standard Deviation (Population) | 16.4% | 5.8% |
Similar Demographics by Disability Age 65 to 74
Demographics Similar to Dutch West Indians by Disability Age 65 to 74
In terms of disability age 65 to 74, the demographic groups most similar to Dutch West Indians are Yakama (29.6%, a difference of 0.23%), Apache (29.7%, a difference of 0.38%), Seminole (29.4%, a difference of 0.45%), Hopi (30.0%, a difference of 1.3%), and Puerto Rican (29.1%, a difference of 1.4%).
| Demographics | Rating | Rank | Disability Age 65 to 74 |
| Nepalese | 0.0 /100 | #318 | Tragic 28.0% |
| Arapaho | 0.0 /100 | #319 | Tragic 28.1% |
| Cherokee | 0.0 /100 | #320 | Tragic 28.2% |
| Comanche | 0.0 /100 | #321 | Tragic 28.3% |
| Aleuts | 0.0 /100 | #322 | Tragic 28.4% |
| Puerto Ricans | 0.0 /100 | #323 | Tragic 29.1% |
| Seminole | 0.0 /100 | #324 | Tragic 29.4% |
| Dutch West Indians | 0.0 /100 | #325 | Tragic 29.6% |
| Yakama | 0.0 /100 | #326 | Tragic 29.6% |
| Apache | 0.0 /100 | #327 | Tragic 29.7% |
| Hopi | 0.0 /100 | #328 | Tragic 30.0% |
| Choctaw | 0.0 /100 | #329 | Tragic 30.2% |
| Creek | 0.0 /100 | #330 | Tragic 30.2% |
| Chickasaw | 0.0 /100 | #331 | Tragic 30.2% |
| Natives/Alaskans | 0.0 /100 | #332 | Tragic 30.4% |
Demographics Similar to Immigrants from Bolivia by Disability Age 65 to 74
In terms of disability age 65 to 74, the demographic groups most similar to Immigrants from Bolivia are Immigrants from Iran (20.9%, a difference of 0.23%), Immigrants from Belgium (21.0%, a difference of 0.53%), Soviet Union (21.0%, a difference of 0.58%), Bolivian (21.0%, a difference of 0.62%), and Immigrants from Australia (21.0%, a difference of 0.64%).
| Demographics | Rating | Rank | Disability Age 65 to 74 |
| Indians (Asian) | 100.0 /100 | #14 | Exceptional 20.5% |
| Paraguayans | 100.0 /100 | #15 | Exceptional 20.5% |
| Immigrants | Lithuania | 100.0 /100 | #16 | Exceptional 20.5% |
| Immigrants | South Central Asia | 100.0 /100 | #17 | Exceptional 20.6% |
| Eastern Europeans | 100.0 /100 | #18 | Exceptional 20.6% |
| Burmese | 100.0 /100 | #19 | Exceptional 20.6% |
| Okinawans | 100.0 /100 | #20 | Exceptional 20.7% |
| Immigrants | Bolivia | 99.9 /100 | #21 | Exceptional 20.8% |
| Immigrants | Iran | 99.9 /100 | #22 | Exceptional 20.9% |
| Immigrants | Belgium | 99.9 /100 | #23 | Exceptional 21.0% |
| Soviet Union | 99.9 /100 | #24 | Exceptional 21.0% |
| Bolivians | 99.9 /100 | #25 | Exceptional 21.0% |
| Immigrants | Australia | 99.9 /100 | #26 | Exceptional 21.0% |
| Immigrants | Sweden | 99.9 /100 | #27 | Exceptional 21.0% |
| Immigrants | Czechoslovakia | 99.9 /100 | #28 | Exceptional 21.0% |