Immigrants from Sri Lanka vs Menominee Disability Age 35 to 64
COMPARE
Immigrants from Sri Lanka
Menominee
Disability Age 35 to 64
Disability Age 35 to 64 Comparison
Immigrants from Sri Lanka
Menominee
9.5%
DISABILITY AGE 35 TO 64
100.0/ 100
METRIC RATING
26th/ 347
METRIC RANK
15.9%
DISABILITY AGE 35 TO 64
0.0/ 100
METRIC RATING
336th/ 347
METRIC RANK
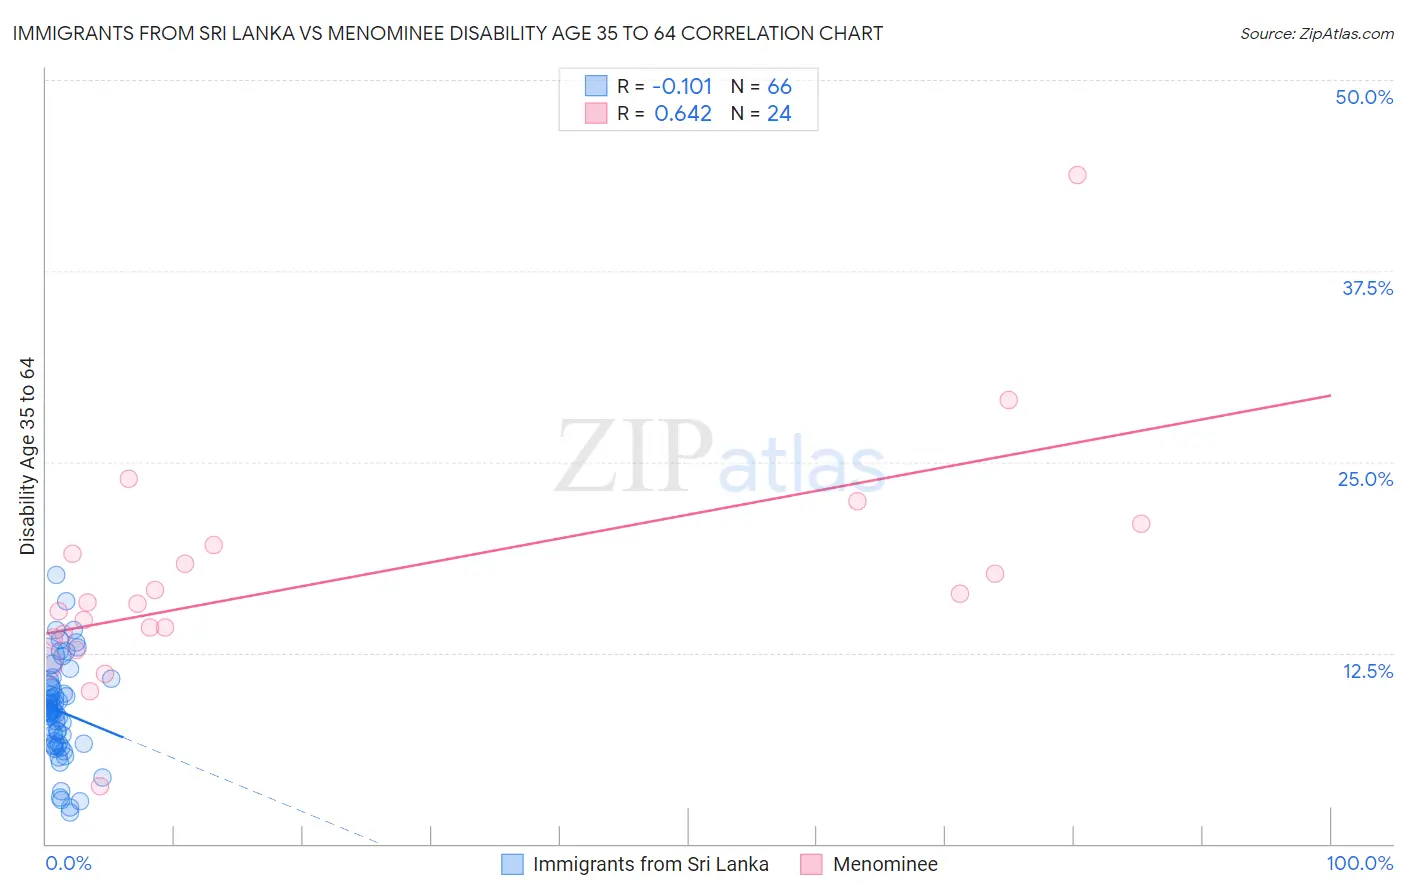
Immigrants from Sri Lanka vs Menominee Disability Age 35 to 64 Correlation Chart
The statistical analysis conducted on geographies consisting of 149,665,674 people shows a poor negative correlation between the proportion of Immigrants from Sri Lanka and percentage of population with a disability between the ages 34 and 64 in the United States with a correlation coefficient (R) of -0.101 and weighted average of 9.5%. Similarly, the statistical analysis conducted on geographies consisting of 45,777,329 people shows a significant positive correlation between the proportion of Menominee and percentage of population with a disability between the ages 34 and 64 in the United States with a correlation coefficient (R) of 0.642 and weighted average of 15.9%, a difference of 68.0%.
Disability Age 35 to 64 Correlation Summary
| Measurement | Immigrants from Sri Lanka | Menominee |
| Minimum | 2.1% | 3.7% |
| Maximum | 17.6% | 43.8% |
| Range | 15.5% | 40.0% |
| Mean | 8.7% | 17.2% |
| Median | 8.7% | 15.7% |
| Interquartile 25% (IQ1) | 6.5% | 13.6% |
| Interquartile 75% (IQ3) | 10.3% | 19.2% |
| Interquartile Range (IQR) | 3.7% | 5.6% |
| Standard Deviation (Sample) | 3.2% | 7.6% |
| Standard Deviation (Population) | 3.2% | 7.4% |
Similar Demographics by Disability Age 35 to 64
Demographics Similar to Immigrants from Sri Lanka by Disability Age 35 to 64
In terms of disability age 35 to 64, the demographic groups most similar to Immigrants from Sri Lanka are Immigrants from Asia (9.5%, a difference of 0.22%), Immigrants from Pakistan (9.5%, a difference of 0.39%), Venezuelan (9.4%, a difference of 0.50%), Asian (9.4%, a difference of 0.79%), and Argentinean (9.4%, a difference of 0.80%).
| Demographics | Rating | Rank | Disability Age 35 to 64 |
| Immigrants | Venezuela | 100.0 /100 | #19 | Exceptional 9.3% |
| Immigrants | Argentina | 100.0 /100 | #20 | Exceptional 9.3% |
| Okinawans | 100.0 /100 | #21 | Exceptional 9.4% |
| Cypriots | 100.0 /100 | #22 | Exceptional 9.4% |
| Argentineans | 100.0 /100 | #23 | Exceptional 9.4% |
| Asians | 100.0 /100 | #24 | Exceptional 9.4% |
| Venezuelans | 100.0 /100 | #25 | Exceptional 9.4% |
| Immigrants | Sri Lanka | 100.0 /100 | #26 | Exceptional 9.5% |
| Immigrants | Asia | 100.0 /100 | #27 | Exceptional 9.5% |
| Immigrants | Pakistan | 100.0 /100 | #28 | Exceptional 9.5% |
| Immigrants | Ireland | 100.0 /100 | #29 | Exceptional 9.5% |
| Immigrants | Japan | 100.0 /100 | #30 | Exceptional 9.5% |
| Immigrants | Lithuania | 99.9 /100 | #31 | Exceptional 9.6% |
| Turks | 99.9 /100 | #32 | Exceptional 9.7% |
| Immigrants | Indonesia | 99.9 /100 | #33 | Exceptional 9.7% |
Demographics Similar to Menominee by Disability Age 35 to 64
In terms of disability age 35 to 64, the demographic groups most similar to Menominee are Seminole (15.9%, a difference of 0.23%), Puerto Rican (15.9%, a difference of 0.32%), Colville (15.8%, a difference of 0.33%), Yuman (15.8%, a difference of 0.53%), and Alaskan Athabascan (15.7%, a difference of 1.1%).
| Demographics | Rating | Rank | Disability Age 35 to 64 |
| Cherokee | 0.0 /100 | #329 | Tragic 15.5% |
| Navajo | 0.0 /100 | #330 | Tragic 15.5% |
| Dutch West Indians | 0.0 /100 | #331 | Tragic 15.6% |
| Alaskan Athabascans | 0.0 /100 | #332 | Tragic 15.7% |
| Yuman | 0.0 /100 | #333 | Tragic 15.8% |
| Colville | 0.0 /100 | #334 | Tragic 15.8% |
| Seminole | 0.0 /100 | #335 | Tragic 15.9% |
| Menominee | 0.0 /100 | #336 | Tragic 15.9% |
| Puerto Ricans | 0.0 /100 | #337 | Tragic 15.9% |
| Chickasaw | 0.0 /100 | #338 | Tragic 16.1% |
| Pima | 0.0 /100 | #339 | Tragic 16.1% |
| Choctaw | 0.0 /100 | #340 | Tragic 16.4% |
| Tsimshian | 0.0 /100 | #341 | Tragic 16.7% |
| Tohono O'odham | 0.0 /100 | #342 | Tragic 16.7% |
| Creek | 0.0 /100 | #343 | Tragic 16.9% |