Immigrants from Sri Lanka vs Immigrants from South Central Asia Disability Age 35 to 64
COMPARE
Immigrants from Sri Lanka
Immigrants from South Central Asia
Disability Age 35 to 64
Disability Age 35 to 64 Comparison
Immigrants from Sri Lanka
Immigrants from South Central Asia
9.5%
DISABILITY AGE 35 TO 64
100.0/ 100
METRIC RATING
26th/ 347
METRIC RANK
8.9%
DISABILITY AGE 35 TO 64
100.0/ 100
METRIC RATING
13th/ 347
METRIC RANK
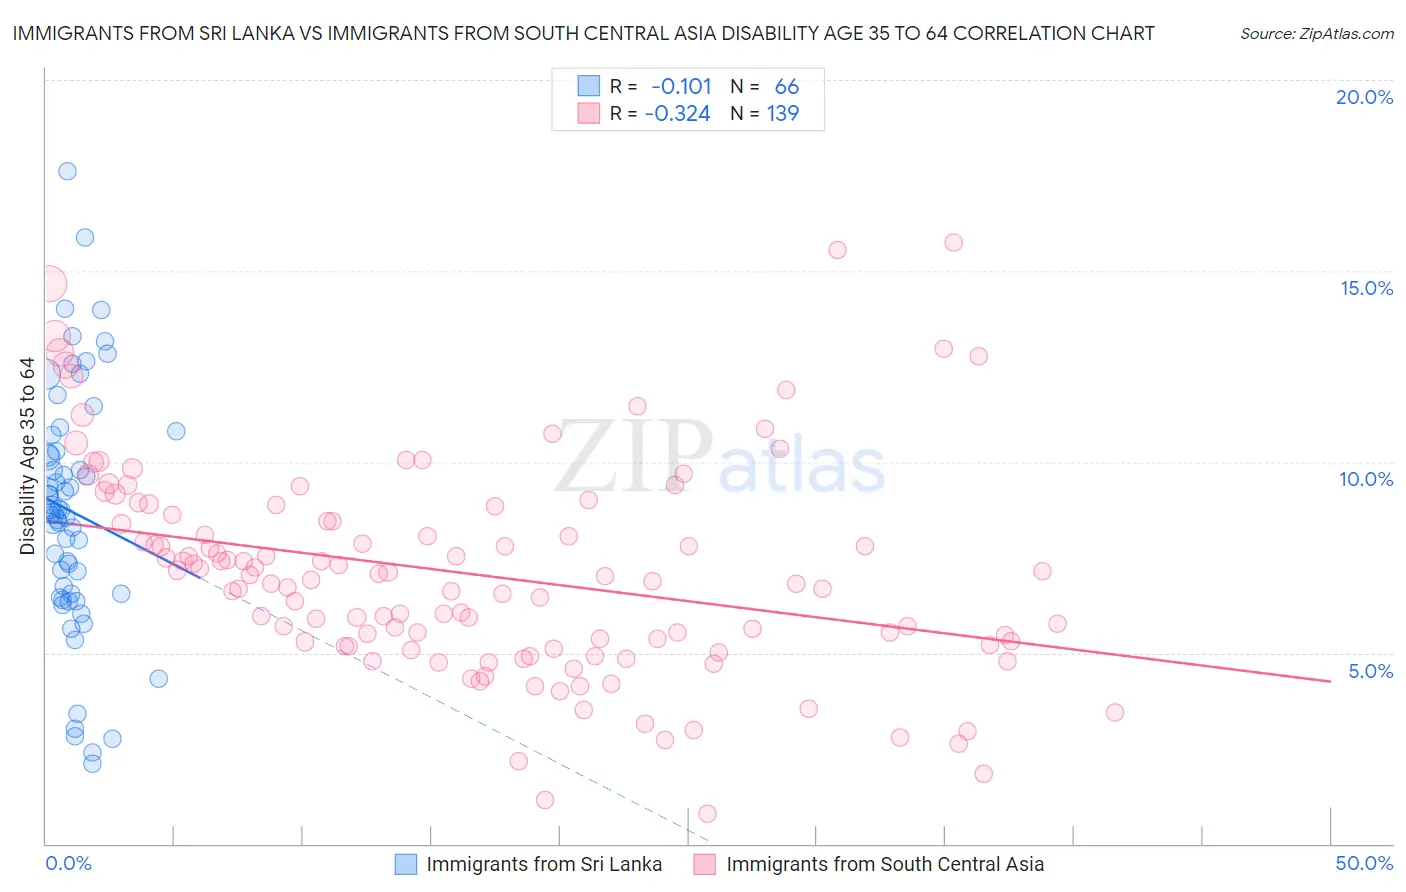
Immigrants from Sri Lanka vs Immigrants from South Central Asia Disability Age 35 to 64 Correlation Chart
The statistical analysis conducted on geographies consisting of 149,665,674 people shows a poor negative correlation between the proportion of Immigrants from Sri Lanka and percentage of population with a disability between the ages 34 and 64 in the United States with a correlation coefficient (R) of -0.101 and weighted average of 9.5%. Similarly, the statistical analysis conducted on geographies consisting of 472,565,910 people shows a mild negative correlation between the proportion of Immigrants from South Central Asia and percentage of population with a disability between the ages 34 and 64 in the United States with a correlation coefficient (R) of -0.324 and weighted average of 8.9%, a difference of 6.7%.
Disability Age 35 to 64 Correlation Summary
| Measurement | Immigrants from Sri Lanka | Immigrants from South Central Asia |
| Minimum | 2.1% | 0.77% |
| Maximum | 17.6% | 15.7% |
| Range | 15.5% | 15.0% |
| Mean | 8.7% | 7.1% |
| Median | 8.7% | 6.9% |
| Interquartile 25% (IQ1) | 6.5% | 5.2% |
| Interquartile 75% (IQ3) | 10.3% | 8.6% |
| Interquartile Range (IQR) | 3.7% | 3.5% |
| Standard Deviation (Sample) | 3.2% | 2.8% |
| Standard Deviation (Population) | 3.2% | 2.8% |
Demographics Similar to Immigrants from Sri Lanka and Immigrants from South Central Asia by Disability Age 35 to 64
In terms of disability age 35 to 64, the demographic groups most similar to Immigrants from Sri Lanka are Immigrants from Asia (9.5%, a difference of 0.22%), Immigrants from Pakistan (9.5%, a difference of 0.39%), Venezuelan (9.4%, a difference of 0.50%), Asian (9.4%, a difference of 0.79%), and Argentinean (9.4%, a difference of 0.80%). Similarly, the demographic groups most similar to Immigrants from South Central Asia are Indian (Asian) (8.9%, a difference of 0.090%), Immigrants from Singapore (8.9%, a difference of 0.60%), Immigrants from Eastern Asia (8.8%, a difference of 0.88%), Bolivian (8.9%, a difference of 0.89%), and Immigrants from Korea (9.0%, a difference of 1.2%).
| Demographics | Rating | Rank | Disability Age 35 to 64 |
| Immigrants | China | 100.0 /100 | #9 | Exceptional 8.7% |
| Immigrants | Bolivia | 100.0 /100 | #10 | Exceptional 8.7% |
| Immigrants | Eastern Asia | 100.0 /100 | #11 | Exceptional 8.8% |
| Indians (Asian) | 100.0 /100 | #12 | Exceptional 8.9% |
| Immigrants | South Central Asia | 100.0 /100 | #13 | Exceptional 8.9% |
| Immigrants | Singapore | 100.0 /100 | #14 | Exceptional 8.9% |
| Bolivians | 100.0 /100 | #15 | Exceptional 8.9% |
| Immigrants | Korea | 100.0 /100 | #16 | Exceptional 9.0% |
| Burmese | 100.0 /100 | #17 | Exceptional 9.2% |
| Soviet Union | 100.0 /100 | #18 | Exceptional 9.2% |
| Immigrants | Venezuela | 100.0 /100 | #19 | Exceptional 9.3% |
| Immigrants | Argentina | 100.0 /100 | #20 | Exceptional 9.3% |
| Okinawans | 100.0 /100 | #21 | Exceptional 9.4% |
| Cypriots | 100.0 /100 | #22 | Exceptional 9.4% |
| Argentineans | 100.0 /100 | #23 | Exceptional 9.4% |
| Asians | 100.0 /100 | #24 | Exceptional 9.4% |
| Venezuelans | 100.0 /100 | #25 | Exceptional 9.4% |
| Immigrants | Sri Lanka | 100.0 /100 | #26 | Exceptional 9.5% |
| Immigrants | Asia | 100.0 /100 | #27 | Exceptional 9.5% |
| Immigrants | Pakistan | 100.0 /100 | #28 | Exceptional 9.5% |
| Immigrants | Ireland | 100.0 /100 | #29 | Exceptional 9.5% |