Immigrants from Southern Europe vs Immigrants from Dominica Vision Disability
COMPARE
Immigrants from Southern Europe
Immigrants from Dominica
Vision Disability
Vision Disability Comparison
Immigrants from Southern Europe
Immigrants from Dominica
2.1%
VISION DISABILITY
74.6/ 100
METRIC RATING
152nd/ 347
METRIC RANK
2.5%
VISION DISABILITY
0.0/ 100
METRIC RATING
297th/ 347
METRIC RANK
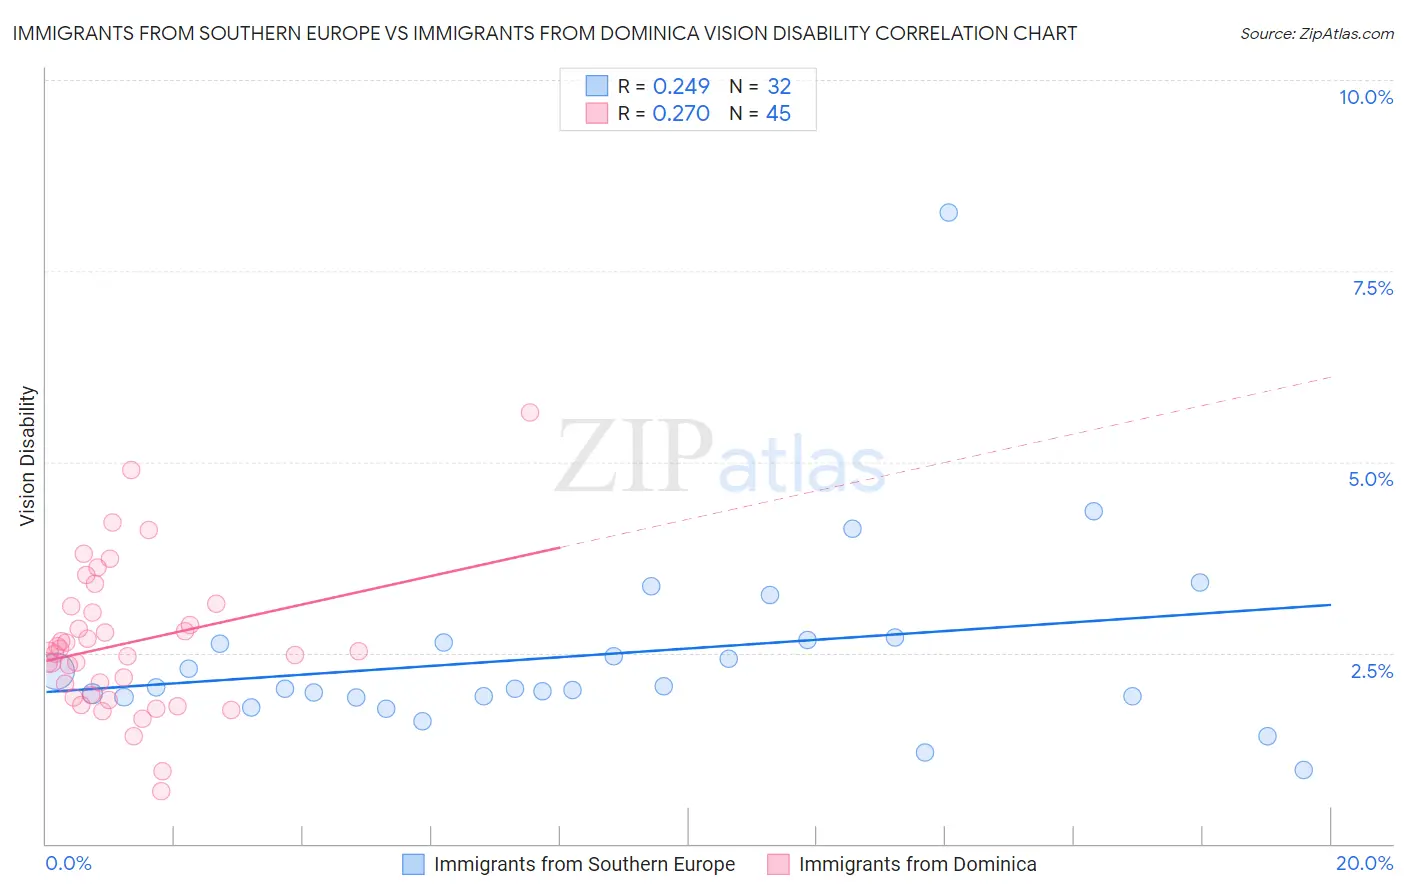
Immigrants from Southern Europe vs Immigrants from Dominica Vision Disability Correlation Chart
The statistical analysis conducted on geographies consisting of 402,373,395 people shows a weak positive correlation between the proportion of Immigrants from Southern Europe and percentage of population with vision disability in the United States with a correlation coefficient (R) of 0.249 and weighted average of 2.1%. Similarly, the statistical analysis conducted on geographies consisting of 83,777,112 people shows a weak positive correlation between the proportion of Immigrants from Dominica and percentage of population with vision disability in the United States with a correlation coefficient (R) of 0.270 and weighted average of 2.5%, a difference of 18.8%.
Vision Disability Correlation Summary
| Measurement | Immigrants from Southern Europe | Immigrants from Dominica |
| Minimum | 0.96% | 0.69% |
| Maximum | 8.3% | 5.7% |
| Range | 7.3% | 5.0% |
| Mean | 2.5% | 2.6% |
| Median | 2.0% | 2.5% |
| Interquartile 25% (IQ1) | 1.9% | 1.9% |
| Interquartile 75% (IQ3) | 2.7% | 3.1% |
| Interquartile Range (IQR) | 0.73% | 1.1% |
| Standard Deviation (Sample) | 1.3% | 0.95% |
| Standard Deviation (Population) | 1.3% | 0.94% |
Similar Demographics by Vision Disability
Demographics Similar to Immigrants from Southern Europe by Vision Disability
In terms of vision disability, the demographic groups most similar to Immigrants from Southern Europe are Immigrants from South America (2.1%, a difference of 0.070%), Immigrants from Norway (2.1%, a difference of 0.080%), Slovene (2.1%, a difference of 0.080%), Belgian (2.1%, a difference of 0.11%), and Colombian (2.1%, a difference of 0.14%).
| Demographics | Rating | Rank | Vision Disability |
| Immigrants | Bosnia and Herzegovina | 81.5 /100 | #145 | Excellent 2.1% |
| Italians | 79.7 /100 | #146 | Good 2.1% |
| Immigrants | Sudan | 78.4 /100 | #147 | Good 2.1% |
| Finns | 78.3 /100 | #148 | Good 2.1% |
| Colombians | 76.2 /100 | #149 | Good 2.1% |
| Belgians | 75.9 /100 | #150 | Good 2.1% |
| Immigrants | Norway | 75.5 /100 | #151 | Good 2.1% |
| Immigrants | Southern Europe | 74.6 /100 | #152 | Good 2.1% |
| Immigrants | South America | 73.8 /100 | #153 | Good 2.1% |
| Slovenes | 73.6 /100 | #154 | Good 2.1% |
| Immigrants | Colombia | 72.1 /100 | #155 | Good 2.1% |
| Pakistanis | 71.6 /100 | #156 | Good 2.1% |
| Serbians | 70.2 /100 | #157 | Good 2.1% |
| Immigrants | Uzbekistan | 69.9 /100 | #158 | Good 2.1% |
| South Africans | 69.8 /100 | #159 | Good 2.1% |
Demographics Similar to Immigrants from Dominica by Vision Disability
In terms of vision disability, the demographic groups most similar to Immigrants from Dominica are Mexican (2.5%, a difference of 0.14%), Cree (2.5%, a difference of 0.17%), African (2.5%, a difference of 0.37%), Menominee (2.5%, a difference of 0.55%), and Immigrants from Mexico (2.5%, a difference of 0.68%).
| Demographics | Rating | Rank | Vision Disability |
| Immigrants | Cuba | 0.0 /100 | #290 | Tragic 2.5% |
| Immigrants | Honduras | 0.0 /100 | #291 | Tragic 2.5% |
| Crow | 0.0 /100 | #292 | Tragic 2.5% |
| Yaqui | 0.0 /100 | #293 | Tragic 2.5% |
| Ottawa | 0.0 /100 | #294 | Tragic 2.5% |
| Delaware | 0.0 /100 | #295 | Tragic 2.5% |
| Immigrants | Mexico | 0.0 /100 | #296 | Tragic 2.5% |
| Immigrants | Dominica | 0.0 /100 | #297 | Tragic 2.5% |
| Mexicans | 0.0 /100 | #298 | Tragic 2.5% |
| Cree | 0.0 /100 | #299 | Tragic 2.5% |
| Africans | 0.0 /100 | #300 | Tragic 2.5% |
| Menominee | 0.0 /100 | #301 | Tragic 2.5% |
| Spanish American Indians | 0.0 /100 | #302 | Tragic 2.6% |
| Immigrants | Cabo Verde | 0.0 /100 | #303 | Tragic 2.6% |
| Aleuts | 0.0 /100 | #304 | Tragic 2.6% |