Immigrants from South Central Asia vs Assyrian/Chaldean/Syriac In Labor Force | Age 45-54
COMPARE
Immigrants from South Central Asia
Assyrian/Chaldean/Syriac
In Labor Force | Age 45-54
In Labor Force | Age 45-54 Comparison
Immigrants from South Central Asia
Assyrians/Chaldeans/Syriacs
84.0%
IN LABOR FORCE | AGE 45-54
99.9/ 100
METRIC RATING
18th/ 347
METRIC RANK
83.2%
IN LABOR FORCE | AGE 45-54
91.7/ 100
METRIC RATING
114th/ 347
METRIC RANK
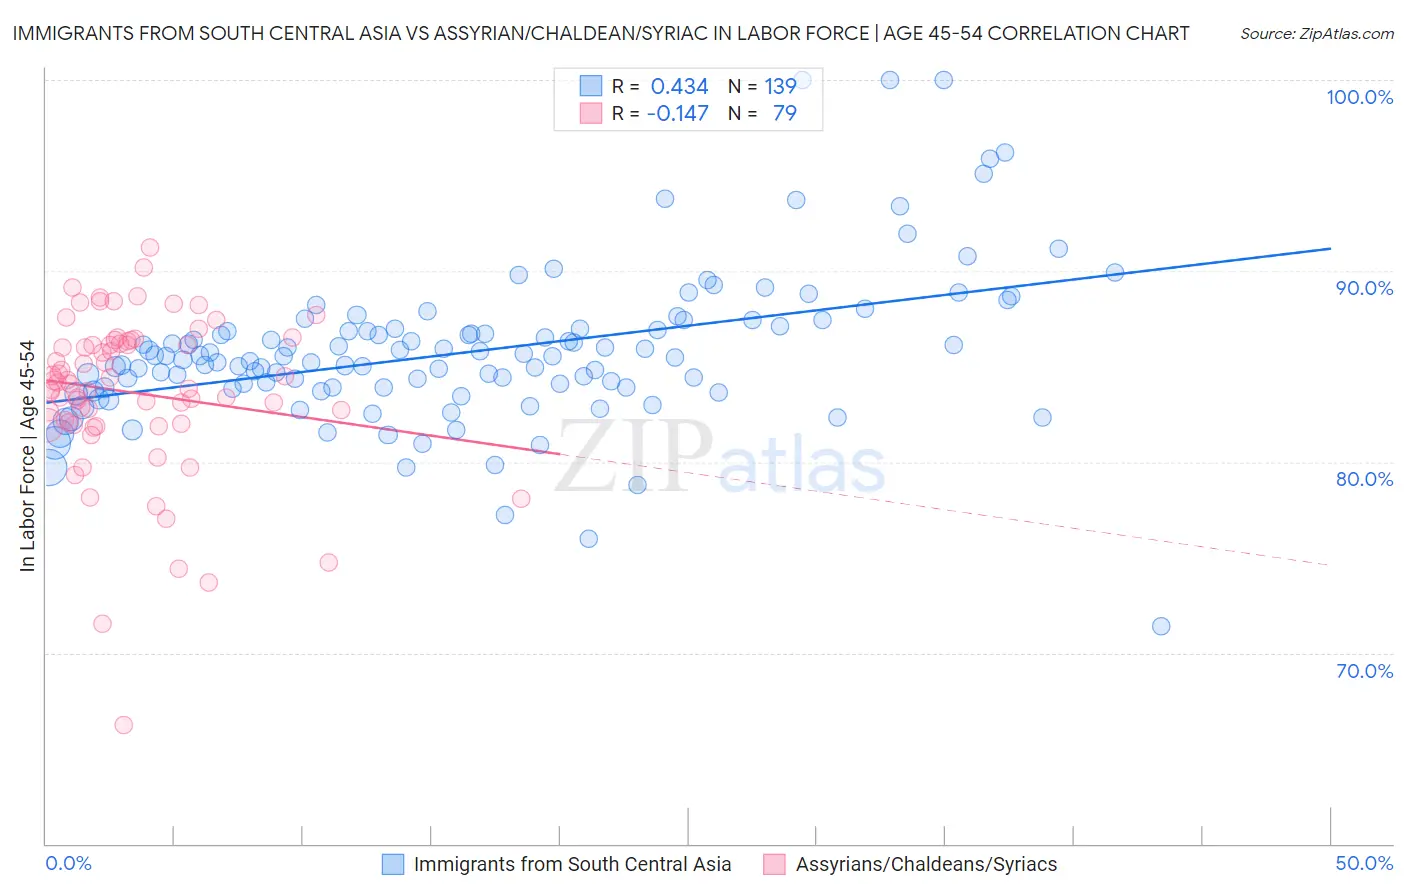
Immigrants from South Central Asia vs Assyrian/Chaldean/Syriac In Labor Force | Age 45-54 Correlation Chart
The statistical analysis conducted on geographies consisting of 472,630,186 people shows a moderate positive correlation between the proportion of Immigrants from South Central Asia and labor force participation rate among population between the ages 45 and 54 in the United States with a correlation coefficient (R) of 0.434 and weighted average of 84.0%. Similarly, the statistical analysis conducted on geographies consisting of 110,290,950 people shows a poor negative correlation between the proportion of Assyrians/Chaldeans/Syriacs and labor force participation rate among population between the ages 45 and 54 in the United States with a correlation coefficient (R) of -0.147 and weighted average of 83.2%, a difference of 0.99%.
In Labor Force | Age 45-54 Correlation Summary
| Measurement | Immigrants from South Central Asia | Assyrian/Chaldean/Syriac |
| Minimum | 71.4% | 66.2% |
| Maximum | 100.0% | 91.2% |
| Range | 28.6% | 25.0% |
| Mean | 85.8% | 83.6% |
| Median | 85.5% | 84.2% |
| Interquartile 25% (IQ1) | 83.9% | 82.0% |
| Interquartile 75% (IQ3) | 87.0% | 86.3% |
| Interquartile Range (IQR) | 3.1% | 4.3% |
| Standard Deviation (Sample) | 4.1% | 4.2% |
| Standard Deviation (Population) | 4.0% | 4.2% |
Similar Demographics by In Labor Force | Age 45-54
Demographics Similar to Immigrants from South Central Asia by In Labor Force | Age 45-54
In terms of in labor force | age 45-54, the demographic groups most similar to Immigrants from South Central Asia are Zimbabwean (84.0%, a difference of 0.0%), Immigrants from Nepal (84.0%, a difference of 0.030%), Cypriot (84.1%, a difference of 0.040%), Cambodian (84.1%, a difference of 0.10%), and Czech (83.9%, a difference of 0.11%).
| Demographics | Rating | Rank | In Labor Force | Age 45-54 |
| Thais | 100.0 /100 | #11 | Exceptional 84.3% |
| Bulgarians | 100.0 /100 | #12 | Exceptional 84.2% |
| Chinese | 99.9 /100 | #13 | Exceptional 84.1% |
| Cambodians | 99.9 /100 | #14 | Exceptional 84.1% |
| Cypriots | 99.9 /100 | #15 | Exceptional 84.1% |
| Immigrants | Nepal | 99.9 /100 | #16 | Exceptional 84.0% |
| Zimbabweans | 99.9 /100 | #17 | Exceptional 84.0% |
| Immigrants | South Central Asia | 99.9 /100 | #18 | Exceptional 84.0% |
| Czechs | 99.8 /100 | #19 | Exceptional 83.9% |
| Immigrants | Eastern Africa | 99.8 /100 | #20 | Exceptional 83.9% |
| Immigrants | Sri Lanka | 99.8 /100 | #21 | Exceptional 83.9% |
| Immigrants | Ireland | 99.8 /100 | #22 | Exceptional 83.9% |
| Tlingit-Haida | 99.8 /100 | #23 | Exceptional 83.9% |
| Slovenes | 99.8 /100 | #24 | Exceptional 83.9% |
| Immigrants | North Macedonia | 99.8 /100 | #25 | Exceptional 83.9% |
Demographics Similar to Assyrians/Chaldeans/Syriacs by In Labor Force | Age 45-54
In terms of in labor force | age 45-54, the demographic groups most similar to Assyrians/Chaldeans/Syriacs are Immigrants from Albania (83.2%, a difference of 0.0%), Immigrants from Chile (83.2%, a difference of 0.0%), Immigrants from Malaysia (83.2%, a difference of 0.010%), Immigrants from Italy (83.2%, a difference of 0.020%), and Immigrants from Afghanistan (83.2%, a difference of 0.020%).
| Demographics | Rating | Rank | In Labor Force | Age 45-54 |
| Iranians | 92.9 /100 | #107 | Exceptional 83.2% |
| Slovaks | 92.8 /100 | #108 | Exceptional 83.2% |
| Ukrainians | 92.7 /100 | #109 | Exceptional 83.2% |
| Immigrants | Africa | 92.6 /100 | #110 | Exceptional 83.2% |
| Immigrants | Italy | 92.5 /100 | #111 | Exceptional 83.2% |
| Immigrants | Afghanistan | 92.4 /100 | #112 | Exceptional 83.2% |
| Immigrants | Albania | 91.8 /100 | #113 | Exceptional 83.2% |
| Assyrians/Chaldeans/Syriacs | 91.7 /100 | #114 | Exceptional 83.2% |
| Immigrants | Chile | 91.6 /100 | #115 | Exceptional 83.2% |
| Immigrants | Malaysia | 91.4 /100 | #116 | Exceptional 83.2% |
| Immigrants | China | 90.9 /100 | #117 | Exceptional 83.2% |
| Immigrants | Europe | 90.7 /100 | #118 | Exceptional 83.2% |
| Immigrants | Uruguay | 90.2 /100 | #119 | Exceptional 83.2% |
| Immigrants | Russia | 90.1 /100 | #120 | Exceptional 83.2% |
| Uruguayans | 89.4 /100 | #121 | Excellent 83.1% |