Cajun vs Immigrants from Ukraine Female Disability
COMPARE
Cajun
Immigrants from Ukraine
Female Disability
Female Disability Comparison
Cajuns
Immigrants from Ukraine
14.9%
FEMALE DISABILITY
0.0/ 100
METRIC RATING
335th/ 347
METRIC RANK
12.1%
FEMALE DISABILITY
64.3/ 100
METRIC RATING
162nd/ 347
METRIC RANK
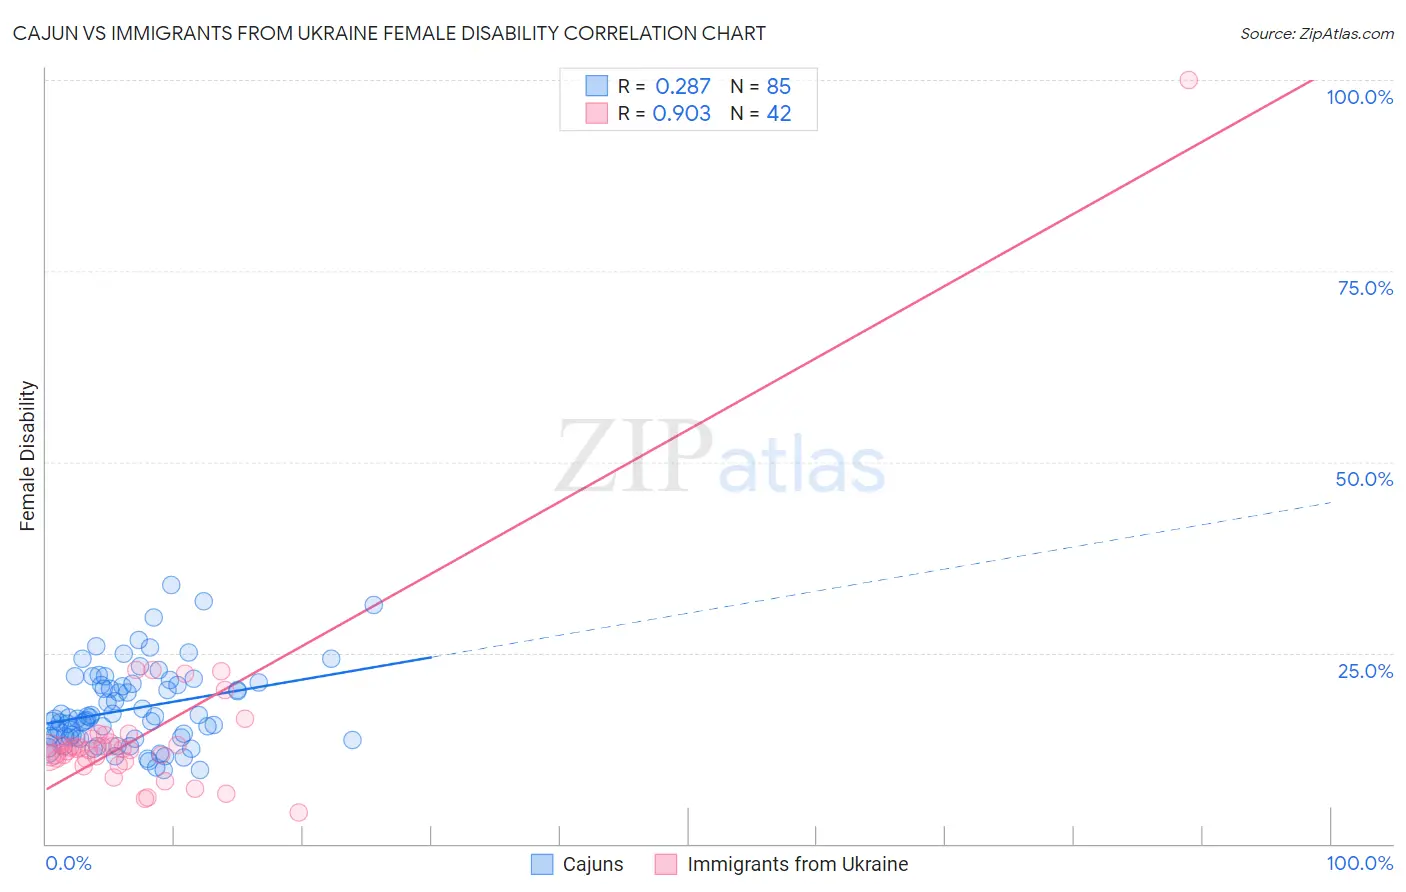
Cajun vs Immigrants from Ukraine Female Disability Correlation Chart
The statistical analysis conducted on geographies consisting of 149,701,485 people shows a weak positive correlation between the proportion of Cajuns and percentage of females with a disability in the United States with a correlation coefficient (R) of 0.287 and weighted average of 14.9%. Similarly, the statistical analysis conducted on geographies consisting of 289,686,189 people shows a near-perfect positive correlation between the proportion of Immigrants from Ukraine and percentage of females with a disability in the United States with a correlation coefficient (R) of 0.903 and weighted average of 12.1%, a difference of 22.6%.
Female Disability Correlation Summary
| Measurement | Cajun | Immigrants from Ukraine |
| Minimum | 9.6% | 4.1% |
| Maximum | 33.8% | 100.0% |
| Range | 24.2% | 95.9% |
| Mean | 17.7% | 14.7% |
| Median | 16.3% | 12.4% |
| Interquartile 25% (IQ1) | 13.9% | 11.1% |
| Interquartile 75% (IQ3) | 20.9% | 13.7% |
| Interquartile Range (IQR) | 7.0% | 2.6% |
| Standard Deviation (Sample) | 5.2% | 14.2% |
| Standard Deviation (Population) | 5.2% | 14.0% |
Similar Demographics by Female Disability
Demographics Similar to Cajuns by Female Disability
In terms of female disability, the demographic groups most similar to Cajuns are Cherokee (14.9%, a difference of 0.020%), Immigrants from the Azores (14.9%, a difference of 0.11%), Pima (14.8%, a difference of 0.50%), Seminole (15.0%, a difference of 0.67%), and Tohono O'odham (15.0%, a difference of 0.80%).
| Demographics | Rating | Rank | Female Disability |
| Cape Verdeans | 0.0 /100 | #328 | Tragic 14.2% |
| Osage | 0.0 /100 | #329 | Tragic 14.3% |
| Yuman | 0.0 /100 | #330 | Tragic 14.5% |
| Immigrants | Cabo Verde | 0.0 /100 | #331 | Tragic 14.6% |
| Pima | 0.0 /100 | #332 | Tragic 14.8% |
| Immigrants | Azores | 0.0 /100 | #333 | Tragic 14.9% |
| Cherokee | 0.0 /100 | #334 | Tragic 14.9% |
| Cajuns | 0.0 /100 | #335 | Tragic 14.9% |
| Seminole | 0.0 /100 | #336 | Tragic 15.0% |
| Tohono O'odham | 0.0 /100 | #337 | Tragic 15.0% |
| Dutch West Indians | 0.0 /100 | #338 | Tragic 15.0% |
| Colville | 0.0 /100 | #339 | Tragic 15.1% |
| Chickasaw | 0.0 /100 | #340 | Tragic 15.2% |
| Choctaw | 0.0 /100 | #341 | Tragic 15.4% |
| Creek | 0.0 /100 | #342 | Tragic 15.7% |
Demographics Similar to Immigrants from Ukraine by Female Disability
In terms of female disability, the demographic groups most similar to Immigrants from Ukraine are Guyanese (12.1%, a difference of 0.010%), Guatemalan (12.1%, a difference of 0.020%), Czech (12.1%, a difference of 0.030%), Immigrants from Guatemala (12.1%, a difference of 0.070%), and Immigrants from Oceania (12.1%, a difference of 0.10%).
| Demographics | Rating | Rank | Female Disability |
| Ghanaians | 76.6 /100 | #155 | Good 12.1% |
| Moroccans | 72.9 /100 | #156 | Good 12.1% |
| Danes | 72.5 /100 | #157 | Good 12.1% |
| Immigrants | Middle Africa | 72.4 /100 | #158 | Good 12.1% |
| Immigrants | Central America | 67.7 /100 | #159 | Good 12.1% |
| Immigrants | Guatemala | 66.0 /100 | #160 | Good 12.1% |
| Guyanese | 64.7 /100 | #161 | Good 12.1% |
| Immigrants | Ukraine | 64.3 /100 | #162 | Good 12.1% |
| Guatemalans | 63.8 /100 | #163 | Good 12.1% |
| Czechs | 63.6 /100 | #164 | Good 12.1% |
| Immigrants | Oceania | 61.8 /100 | #165 | Good 12.1% |
| Lithuanians | 59.5 /100 | #166 | Average 12.2% |
| Immigrants | Latin America | 59.0 /100 | #167 | Average 12.2% |
| Immigrants | Haiti | 58.8 /100 | #168 | Average 12.2% |
| Lebanese | 58.1 /100 | #169 | Average 12.2% |