Immigrants from Sierra Leone vs Paraguayan Male Disability

COMPARE

Immigrants from Sierra Leone
Race
Ancestry
AfghanAfricanAlaska NativeAlaskan AthabascanAlbanianAleutAlsatianAmericanApacheArabArapahoArgentineanArmenianAssyrian/Chaldean/SyriacAustralianAustrianBahamianBangladeshiBarbadianBasqueBelgianBelizeanBermudanBhutaneseBlackfeetBolivianBrazilianBritishBritish West IndianBulgarianBurmeseCajunCambodianCanadianCape VerdeanCarpatho RusynCelticCentral AmericanCentral American IndianCherokeeCheyenneChickasawChileanChineseChippewaChoctawColombianColvilleComancheCosta RicanCreeCreekCroatianCrowCubanCypriotCzechCzechoslovakianDanishDelawareDominicanDutchDutch West IndianEastern EuropeanEcuadorianEgyptianEnglishEstonianEthiopianEuropeanFijianFilipinoFinnishFrenchFrench American IndianFrench CanadianGermanGerman RussianGhanaianGreekGuamanian/ChamorroGuatemalanGuyaneseHaitianHmongHonduranHopiHoumaHungarianIcelanderIndian (Asian)IndonesianInupiatIranianIraqiIrishIroquoisIsraeliItalianJamaicanJapaneseJordanianKenyanKiowaKoreanLaotianLatvianLebaneseLiberianLithuanianLumbeeLuxembourgerMacedonianMalaysianMalteseMarshalleseMenomineeMexicanMexican American IndianMongolianMoroccanNative HawaiianNavajoNepaleseNew ZealanderNicaraguanNigerianNorthern EuropeanNorwegianOkinawanOsageOttawaPaiutePakistaniPalestinianPanamanianPennsylvania GermanPeruvianPimaPolishPortuguesePotawatomiPuebloPuerto RicanPuget Sound SalishRomanianRussianSalvadoranSamoanScandinavianScotch-IrishScottishSeminoleSenegaleseSerbianShoshoneSierra LeoneanSiouxSlavicSlovakSloveneSomaliSouth AfricanSouth AmericanSouth American IndianSoviet UnionSpaniardSpanishSpanish AmericanSpanish American IndianSri LankanSubsaharan AfricanSudaneseSwedishSwissSyrianTaiwaneseThaiTlingit-HaidaTohono O'OdhamTonganTrinidadian and TobagonianTsimshianTurkishU.S. Virgin IslanderUgandanUkrainianUruguayanUteVenezuelanVietnameseWelshWest IndianYakamaYaquiYugoslavianYumanYup'ikZimbabwean
Immigration
NonimmigrantsImmigrantsAfghanistanAfricaAlbaniaArgentinaArmeniaAsiaAustraliaAustriaBahamasBangladeshBarbadosBelarusBelgiumBelizeBoliviaBosnia and HerzegovinaBrazilBulgariaBurma/MyanmarCabo VerdeCambodiaCameroonCanadaCaribbeanCentral AmericaChileChinaColombiaCongoCosta RicaCroatiaCubaCzechoslovakiaDenmarkDominicaDominican RepublicEastern AfricaEastern AsiaEastern EuropeEcuadorEgyptEl SalvadorEnglandEritreaEthiopiaEuropeFijiFranceGermanyGhanaGreeceGrenadaGuatemalaGuyanaHaitiHondurasHong KongHungaryIndiaIndonesiaIranIraqIrelandIsraelItalyJamaicaJapanJordanKazakhstanKenyaKoreaKuwaitLaosLatin AmericaLatviaLebanonLiberiaLithuaniaMalaysiaMexicoMicronesiaMiddle AfricaMoldovaMoroccoNepalNetherlandsNicaraguaNigeriaNorth AmericaNorth MacedoniaNorthern AfricaNorthern EuropeNorwayOceaniaPakistanPanamaPeruPhilippinesPolandPortugalRomaniaRussiaSaudi ArabiaScotlandSenegalSerbiaSierra LeoneSingaporeSomaliaSouth AfricaSouth AmericaSouth Central AsiaSouth Eastern AsiaSouthern EuropeSpainSri LankaSt. Vincent and the GrenadinesSudanSwedenSwitzerlandSyriaTaiwanThailandTrinidad and TobagoTurkeyUgandaUkraineUruguayUzbekistanVenezuelaVietnamWest IndiesWestern AfricaWestern AsiaWestern EuropeYemenZaireZimbabweAzores
Paraguayan
Race
Ancestry
AfghanAfricanAlaska NativeAlaskan AthabascanAlbanianAleutAlsatianAmericanApacheArabArapahoArgentineanArmenianAssyrian/Chaldean/SyriacAustralianAustrianBahamianBangladeshiBarbadianBasqueBelgianBelizeanBermudanBhutaneseBlackfeetBolivianBrazilianBritishBritish West IndianBulgarianBurmeseCajunCambodianCanadianCape VerdeanCarpatho RusynCelticCentral AmericanCentral American IndianCherokeeCheyenneChickasawChileanChineseChippewaChoctawColombianColvilleComancheCosta RicanCreeCreekCroatianCrowCubanCypriotCzechCzechoslovakianDanishDelawareDominicanDutchDutch West IndianEastern EuropeanEcuadorianEgyptianEnglishEstonianEthiopianEuropeanFijianFilipinoFinnishFrenchFrench American IndianFrench CanadianGermanGerman RussianGhanaianGreekGuamanian/ChamorroGuatemalanGuyaneseHaitianHmongHonduranHopiHoumaHungarianIcelanderIndian (Asian)IndonesianInupiatIranianIraqiIrishIroquoisIsraeliItalianJamaicanJapaneseJordanianKenyanKiowaKoreanLaotianLatvianLebaneseLiberianLithuanianLumbeeLuxembourgerMacedonianMalaysianMalteseMarshalleseMenomineeMexicanMexican American IndianMongolianMoroccanNative HawaiianNavajoNepaleseNew ZealanderNicaraguanNigerianNorthern EuropeanNorwegianOkinawanOsageOttawaPaiutePakistaniPalestinianPanamanianParaguayanPennsylvania GermanPeruvianPimaPolishPortuguesePotawatomiPuebloPuerto RicanPuget Sound SalishRomanianRussianSalvadoranSamoanScandinavianScotch-IrishScottishSeminoleSenegaleseSerbianShoshoneSierra LeoneanSiouxSlavicSlovakSloveneSomaliSouth AfricanSouth AmericanSouth American IndianSoviet UnionSpaniardSpanishSpanish AmericanSpanish American IndianSri LankanSubsaharan AfricanSudaneseSwedishSwissSyrianTaiwaneseThaiTlingit-HaidaTohono O'OdhamTonganTrinidadian and TobagonianTsimshianTurkishU.S. Virgin IslanderUgandanUkrainianUruguayanUteVenezuelanVietnameseWelshWest IndianYakamaYaquiYugoslavianYumanYup'ikZimbabwean
Immigration
NonimmigrantsImmigrantsAfghanistanAfricaAlbaniaArgentinaArmeniaAsiaAustraliaAustriaBahamasBangladeshBarbadosBelarusBelgiumBelizeBoliviaBosnia and HerzegovinaBrazilBulgariaBurma/MyanmarCabo VerdeCambodiaCameroonCanadaCaribbeanCentral AmericaChileChinaColombiaCongoCosta RicaCroatiaCubaCzechoslovakiaDenmarkDominicaDominican RepublicEastern AfricaEastern AsiaEastern EuropeEcuadorEgyptEl SalvadorEnglandEritreaEthiopiaEuropeFijiFranceGermanyGhanaGreeceGrenadaGuatemalaGuyanaHaitiHondurasHong KongHungaryIndiaIndonesiaIranIraqIrelandIsraelItalyJamaicaJapanJordanKazakhstanKenyaKoreaKuwaitLaosLatin AmericaLatviaLebanonLiberiaLithuaniaMalaysiaMexicoMicronesiaMiddle AfricaMoldovaMoroccoNepalNetherlandsNicaraguaNigeriaNorth AmericaNorth MacedoniaNorthern AfricaNorthern EuropeNorwayOceaniaPakistanPanamaPeruPhilippinesPolandPortugalRomaniaRussiaSaudi ArabiaScotlandSenegalSerbiaSingaporeSomaliaSouth AfricaSouth AmericaSouth Central AsiaSouth Eastern AsiaSouthern EuropeSpainSri LankaSt. Vincent and the GrenadinesSudanSwedenSwitzerlandSyriaTaiwanThailandTrinidad and TobagoTurkeyUgandaUkraineUruguayUzbekistanVenezuelaVietnamWest IndiesWestern AfricaWestern AsiaWestern EuropeYemenZaireZimbabweAzores
Male Disability
Income
Poverty
Unemployment
Labor Participation
Family Structure
Vehicle Availability
Education Level
Disability

Male Disability Comparison

Immigrants from Sierra Leone

Paraguayans

Exceptional
Exceptional
10.5%
MALE DISABILITY
98.7/ 100
METRIC RATING
76th/ 347
METRIC RANK
10.1%
MALE DISABILITY
99.9/ 100
METRIC RATING
26th/ 347
METRIC RANK

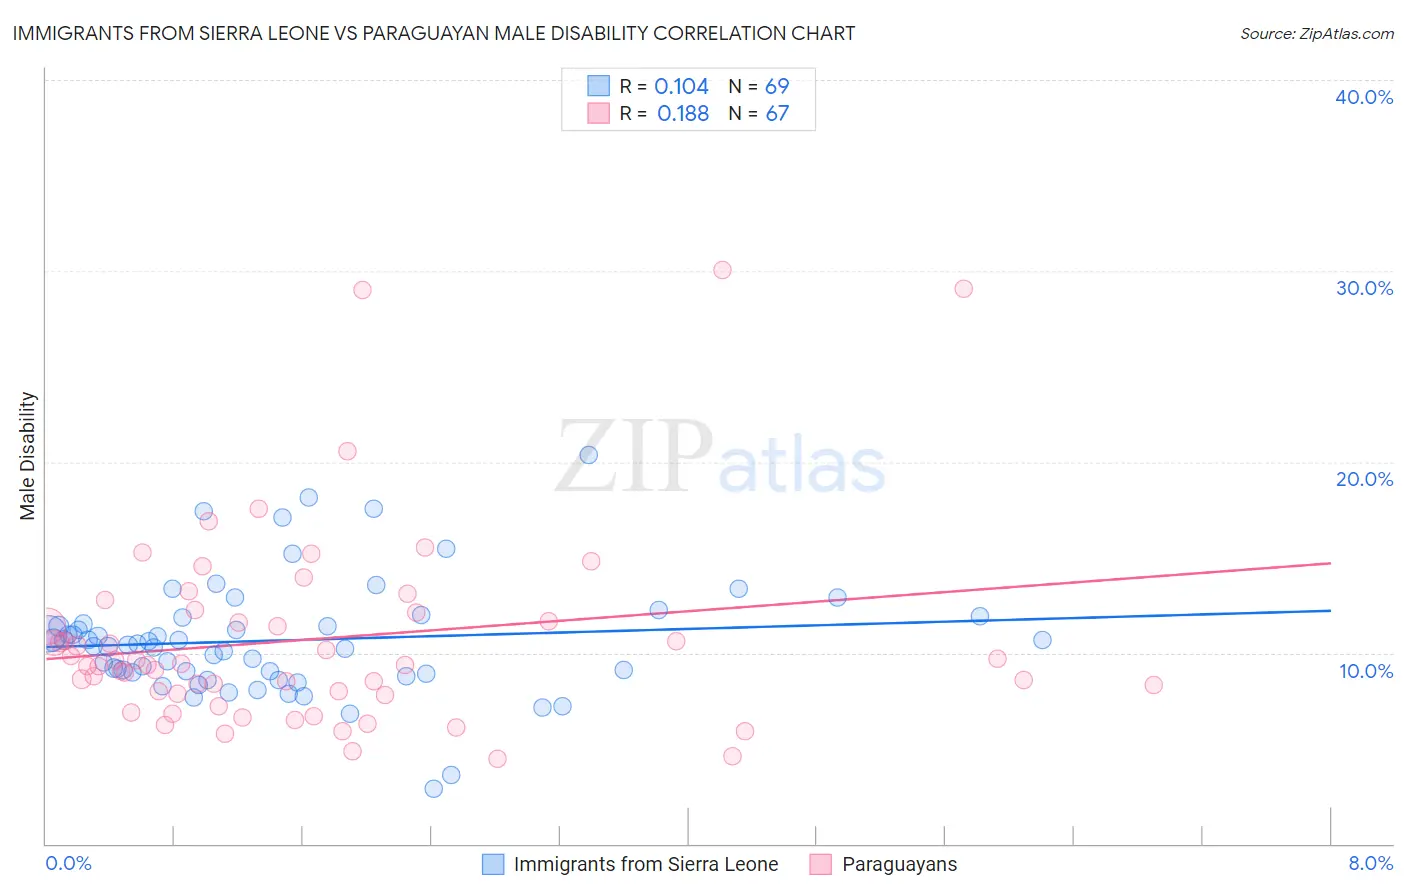
Immigrants from Sierra Leone vs Paraguayan Male Disability Correlation Chart

The statistical analysis conducted on geographies consisting of 101,648,107 people shows a poor positive correlation between the proportion of Immigrants from Sierra Leone and percentage of males with a disability in the United States with a correlation coefficient (R) of 0.104 and weighted average of 10.5%. Similarly, the statistical analysis conducted on geographies consisting of 95,111,700 people shows a poor positive correlation between the proportion of Paraguayans and percentage of males with a disability in the United States with a correlation coefficient (R) of 0.188 and weighted average of 10.1%, a difference of 4.8%.
Immigrants from Sierra Leone vs Paraguayan Male Disability

Male Disability Correlation Summary

MeasurementImmigrants from Sierra LeoneParaguayan
Minimum2.9%4.4%
Maximum20.4%30.1%
Range17.5%25.6%
Mean10.6%10.7%
Median10.4%9.4%
Interquartile 25% (IQ1)8.9%7.9%
Interquartile 75% (IQ3)11.7%12.1%
Interquartile Range (IQR)2.8%4.2%
Standard Deviation (Sample)3.0%5.2%
Standard Deviation (Population)3.0%5.2%

Similar Demographics by Male Disability

Demographics Similar to Immigrants from Sierra Leone by Male Disability

In terms of male disability, the demographic groups most similar to Immigrants from Sierra Leone are Sierra Leonean (10.5%, a difference of 0.040%), Laotian (10.6%, a difference of 0.060%), Immigrants from Russia (10.6%, a difference of 0.080%), Immigrants from Lebanon (10.5%, a difference of 0.16%), and Immigrants from Lithuania (10.5%, a difference of 0.30%).
DemographicsRating | RankMale Disability
Ecuadorians
99.2
/100
|
#69
Exceptional
10.5%
Immigrants | Bulgaria
99.1
/100
|
#70
Exceptional
10.5%
Immigrants | Cameroon
99.0
/100
|
#71
Exceptional
10.5%
Immigrants | Serbia
99.0
/100
|
#72
Exceptional
10.5%
Immigrants | Lithuania
98.9
/100
|
#73
Exceptional
10.5%
Immigrants | Lebanon
98.8
/100
|
#74
Exceptional
10.5%
Sierra Leoneans
98.7
/100
|
#75
Exceptional
10.5%
Immigrants | Sierra Leone
98.7
/100
|
#76
Exceptional
10.5%
Laotians
98.6
/100
|
#77
Exceptional
10.6%
Immigrants | Russia
98.6
/100
|
#78
Exceptional
10.6%
Zimbabweans
98.4
/100
|
#79
Exceptional
10.6%
Immigrants | Jordan
98.4
/100
|
#80
Exceptional
10.6%
Immigrants | Chile
98.3
/100
|
#81
Exceptional
10.6%
Immigrants | Guyana
98.2
/100
|
#82
Exceptional
10.6%
Immigrants | Poland
98.1
/100
|
#83
Exceptional
10.6%

Demographics Similar to Paraguayans by Male Disability

In terms of male disability, the demographic groups most similar to Paraguayans are Immigrants from Malaysia (10.0%, a difference of 0.13%), Immigrants from Asia (10.0%, a difference of 0.32%), Egyptian (10.1%, a difference of 0.32%), Vietnamese (10.1%, a difference of 0.34%), and Cypriot (10.0%, a difference of 0.45%).
DemographicsRating | RankMale Disability
Immigrants | Sri Lanka
100.0
/100
|
#19
Exceptional
10.0%
Asians
100.0
/100
|
#20
Exceptional
10.0%
Burmese
100.0
/100
|
#21
Exceptional
10.0%
Immigrants | Venezuela
100.0
/100
|
#22
Exceptional
10.0%
Cypriots
100.0
/100
|
#23
Exceptional
10.0%
Immigrants | Asia
100.0
/100
|
#24
Exceptional
10.0%
Immigrants | Malaysia
99.9
/100
|
#25
Exceptional
10.0%
Paraguayans
99.9
/100
|
#26
Exceptional
10.1%
Egyptians
99.9
/100
|
#27
Exceptional
10.1%
Vietnamese
99.9
/100
|
#28
Exceptional
10.1%
Venezuelans
99.9
/100
|
#29
Exceptional
10.1%
Immigrants | Egypt
99.9
/100
|
#30
Exceptional
10.1%
Soviet Union
99.9
/100
|
#31
Exceptional
10.1%
Argentineans
99.9
/100
|
#32
Exceptional
10.1%
Immigrants | Ethiopia
99.9
/100
|
#33
Exceptional
10.2%