Immigrants from Senegal vs Moroccan Disability Age 65 to 74
COMPARE
Immigrants from Senegal
Moroccan
Disability Age 65 to 74
Disability Age 65 to 74 Comparison
Immigrants from Senegal
Moroccans
24.6%
DISABILITY AGE 65 TO 74
2.2/ 100
METRIC RATING
242nd/ 347
METRIC RANK
23.3%
DISABILITY AGE 65 TO 74
54.2/ 100
METRIC RATING
170th/ 347
METRIC RANK
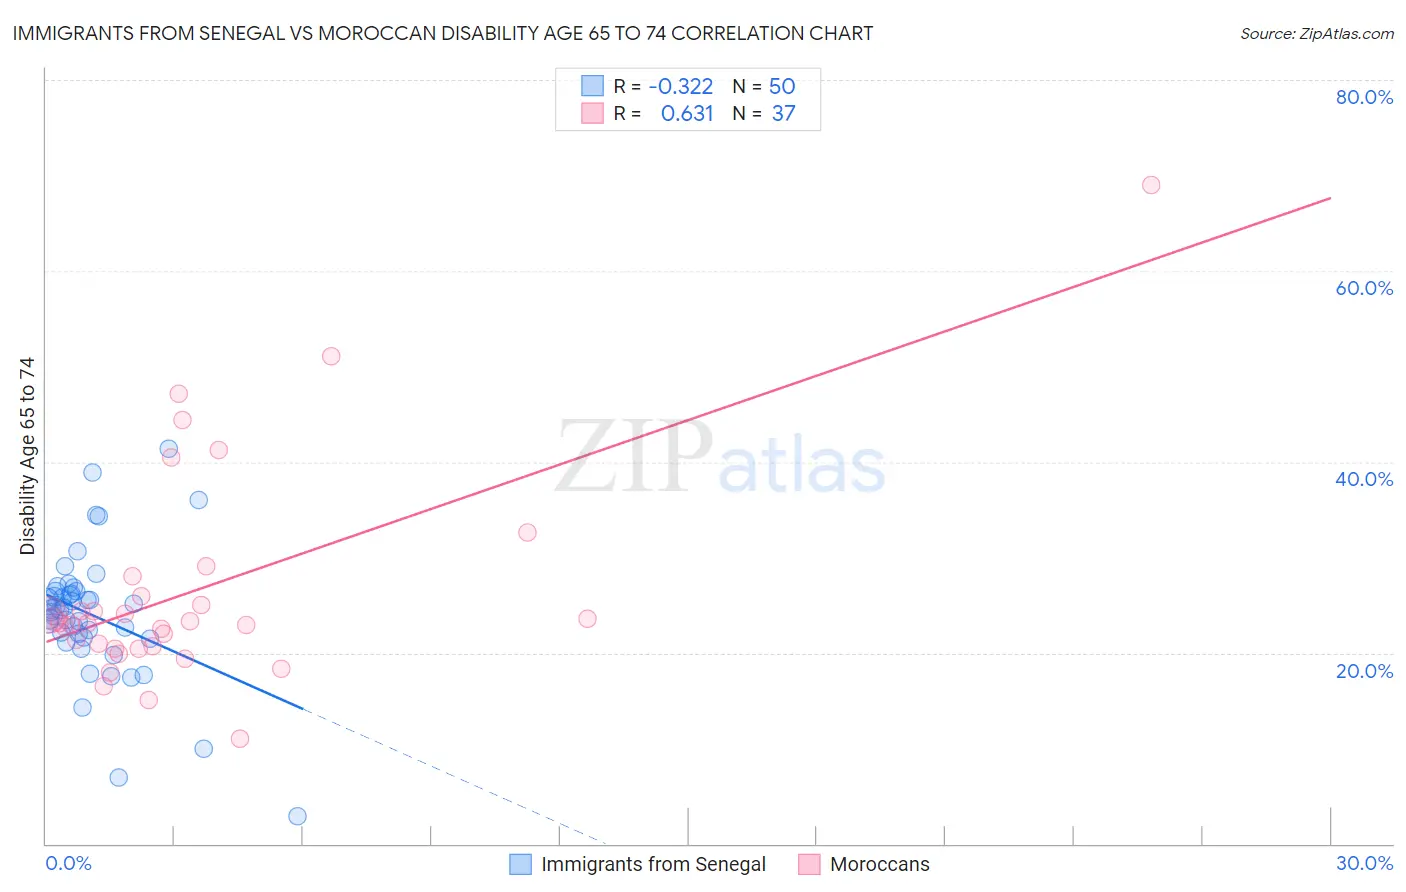
Immigrants from Senegal vs Moroccan Disability Age 65 to 74 Correlation Chart
The statistical analysis conducted on geographies consisting of 90,101,163 people shows a mild negative correlation between the proportion of Immigrants from Senegal and percentage of population with a disability between the ages 65 and 75 in the United States with a correlation coefficient (R) of -0.322 and weighted average of 24.6%. Similarly, the statistical analysis conducted on geographies consisting of 201,651,001 people shows a significant positive correlation between the proportion of Moroccans and percentage of population with a disability between the ages 65 and 75 in the United States with a correlation coefficient (R) of 0.631 and weighted average of 23.3%, a difference of 5.8%.
Disability Age 65 to 74 Correlation Summary
| Measurement | Immigrants from Senegal | Moroccan |
| Minimum | 2.9% | 11.0% |
| Maximum | 41.4% | 69.0% |
| Range | 38.5% | 58.0% |
| Mean | 24.0% | 26.6% |
| Median | 24.5% | 23.2% |
| Interquartile 25% (IQ1) | 21.6% | 20.6% |
| Interquartile 75% (IQ3) | 26.4% | 27.0% |
| Interquartile Range (IQR) | 4.8% | 6.4% |
| Standard Deviation (Sample) | 6.8% | 11.4% |
| Standard Deviation (Population) | 6.8% | 11.2% |
Similar Demographics by Disability Age 65 to 74
Demographics Similar to Immigrants from Senegal by Disability Age 65 to 74
In terms of disability age 65 to 74, the demographic groups most similar to Immigrants from Senegal are Spanish (24.6%, a difference of 0.010%), Immigrants from Western Africa (24.6%, a difference of 0.080%), Armenian (24.7%, a difference of 0.14%), British West Indian (24.7%, a difference of 0.14%), and Spaniard (24.6%, a difference of 0.16%).
| Demographics | Rating | Rank | Disability Age 65 to 74 |
| Scotch-Irish | 3.8 /100 | #235 | Tragic 24.4% |
| German Russians | 3.7 /100 | #236 | Tragic 24.4% |
| West Indians | 3.4 /100 | #237 | Tragic 24.5% |
| Immigrants | Ghana | 3.0 /100 | #238 | Tragic 24.5% |
| Immigrants | Caribbean | 2.6 /100 | #239 | Tragic 24.6% |
| Spaniards | 2.4 /100 | #240 | Tragic 24.6% |
| Immigrants | Western Africa | 2.3 /100 | #241 | Tragic 24.6% |
| Immigrants | Senegal | 2.2 /100 | #242 | Tragic 24.6% |
| Spanish | 2.2 /100 | #243 | Tragic 24.6% |
| Armenians | 2.0 /100 | #244 | Tragic 24.7% |
| British West Indians | 2.0 /100 | #245 | Tragic 24.7% |
| Immigrants | Iraq | 1.9 /100 | #246 | Tragic 24.7% |
| Indonesians | 1.1 /100 | #247 | Tragic 24.9% |
| Senegalese | 0.9 /100 | #248 | Tragic 24.9% |
| Immigrants | Fiji | 0.8 /100 | #249 | Tragic 25.0% |
Demographics Similar to Moroccans by Disability Age 65 to 74
In terms of disability age 65 to 74, the demographic groups most similar to Moroccans are Icelander (23.3%, a difference of 0.010%), Cuban (23.3%, a difference of 0.13%), Pakistani (23.2%, a difference of 0.16%), Immigrants from Bosnia and Herzegovina (23.2%, a difference of 0.20%), and German (23.3%, a difference of 0.22%).
| Demographics | Rating | Rank | Disability Age 65 to 74 |
| Immigrants | Philippines | 61.1 /100 | #163 | Good 23.2% |
| Sierra Leoneans | 60.9 /100 | #164 | Good 23.2% |
| Vietnamese | 60.8 /100 | #165 | Good 23.2% |
| Immigrants | Afghanistan | 60.5 /100 | #166 | Good 23.2% |
| Immigrants | Bosnia and Herzegovina | 57.6 /100 | #167 | Average 23.2% |
| Pakistanis | 57.0 /100 | #168 | Average 23.2% |
| Icelanders | 54.3 /100 | #169 | Average 23.3% |
| Moroccans | 54.2 /100 | #170 | Average 23.3% |
| Cubans | 51.9 /100 | #171 | Average 23.3% |
| Germans | 50.5 /100 | #172 | Average 23.3% |
| Yugoslavians | 50.2 /100 | #173 | Average 23.3% |
| Immigrants | South Eastern Asia | 50.0 /100 | #174 | Average 23.3% |
| Dutch | 49.4 /100 | #175 | Average 23.3% |
| Immigrants | Eritrea | 47.5 /100 | #176 | Average 23.4% |
| Immigrants | Haiti | 47.5 /100 | #177 | Average 23.4% |