Immigrants from Panama vs Slovak Disability Age 35 to 64
COMPARE
Immigrants from Panama
Slovak
Disability Age 35 to 64
Disability Age 35 to 64 Comparison
Immigrants from Panama
Slovaks
11.6%
DISABILITY AGE 35 TO 64
20.4/ 100
METRIC RATING
198th/ 347
METRIC RANK
12.1%
DISABILITY AGE 35 TO 64
2.7/ 100
METRIC RATING
243rd/ 347
METRIC RANK
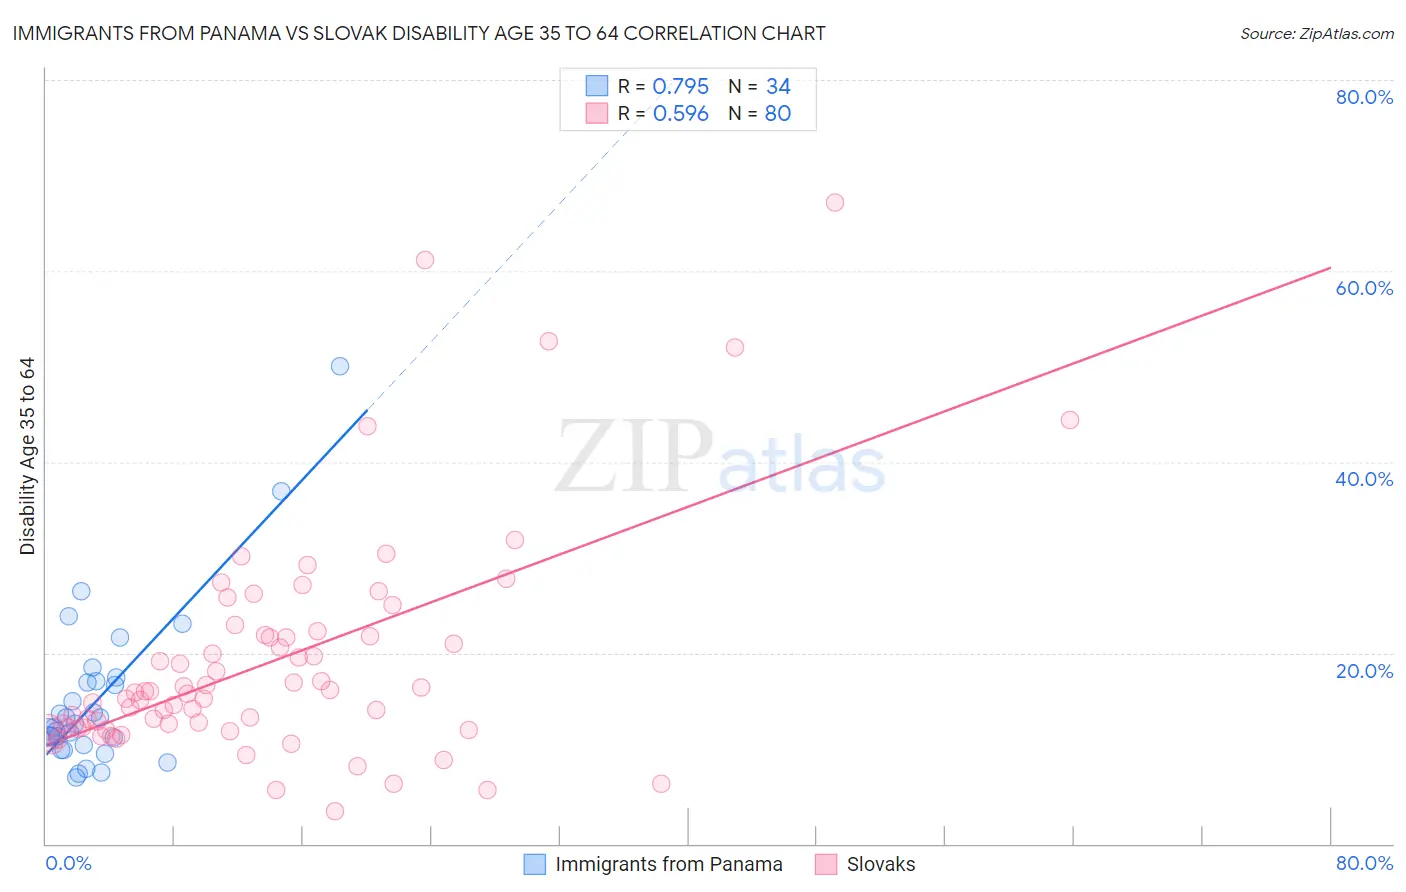
Immigrants from Panama vs Slovak Disability Age 35 to 64 Correlation Chart
The statistical analysis conducted on geographies consisting of 221,148,326 people shows a strong positive correlation between the proportion of Immigrants from Panama and percentage of population with a disability between the ages 34 and 64 in the United States with a correlation coefficient (R) of 0.795 and weighted average of 11.6%. Similarly, the statistical analysis conducted on geographies consisting of 397,624,884 people shows a substantial positive correlation between the proportion of Slovaks and percentage of population with a disability between the ages 34 and 64 in the United States with a correlation coefficient (R) of 0.596 and weighted average of 12.1%, a difference of 4.4%.
Disability Age 35 to 64 Correlation Summary
| Measurement | Immigrants from Panama | Slovak |
| Minimum | 6.9% | 3.4% |
| Maximum | 50.0% | 67.2% |
| Range | 43.1% | 63.8% |
| Mean | 15.3% | 19.1% |
| Median | 12.4% | 15.8% |
| Interquartile 25% (IQ1) | 10.4% | 12.1% |
| Interquartile 75% (IQ3) | 17.0% | 21.8% |
| Interquartile Range (IQR) | 6.6% | 9.7% |
| Standard Deviation (Sample) | 8.8% | 11.9% |
| Standard Deviation (Population) | 8.7% | 11.8% |
Similar Demographics by Disability Age 35 to 64
Demographics Similar to Immigrants from Panama by Disability Age 35 to 64
In terms of disability age 35 to 64, the demographic groups most similar to Immigrants from Panama are Immigrants from Iraq (11.6%, a difference of 0.080%), Basque (11.6%, a difference of 0.11%), Swiss (11.6%, a difference of 0.21%), Immigrants from Kenya (11.6%, a difference of 0.34%), and Immigrants from Guatemala (11.6%, a difference of 0.36%).
| Demographics | Rating | Rank | Disability Age 35 to 64 |
| Swedes | 31.3 /100 | #191 | Fair 11.4% |
| Norwegians | 29.7 /100 | #192 | Fair 11.5% |
| Immigrants | Africa | 29.0 /100 | #193 | Fair 11.5% |
| Immigrants | Latin America | 27.5 /100 | #194 | Fair 11.5% |
| Carpatho Rusyns | 25.3 /100 | #195 | Fair 11.5% |
| Iraqis | 24.2 /100 | #196 | Fair 11.5% |
| Immigrants | Iraq | 21.0 /100 | #197 | Fair 11.6% |
| Immigrants | Panama | 20.4 /100 | #198 | Fair 11.6% |
| Basques | 19.5 /100 | #199 | Poor 11.6% |
| Swiss | 18.7 /100 | #200 | Poor 11.6% |
| Immigrants | Kenya | 17.7 /100 | #201 | Poor 11.6% |
| Immigrants | Guatemala | 17.5 /100 | #202 | Poor 11.6% |
| British | 17.0 /100 | #203 | Poor 11.6% |
| Nigerians | 16.3 /100 | #204 | Poor 11.6% |
| Slavs | 15.5 /100 | #205 | Poor 11.7% |
Demographics Similar to Slovaks by Disability Age 35 to 64
In terms of disability age 35 to 64, the demographic groups most similar to Slovaks are Samoan (12.1%, a difference of 0.10%), Finnish (12.1%, a difference of 0.26%), Immigrants from Mexico (12.1%, a difference of 0.36%), Mexican American Indian (12.0%, a difference of 0.37%), and Immigrants from Thailand (12.0%, a difference of 0.39%).
| Demographics | Rating | Rank | Disability Age 35 to 64 |
| Immigrants | Middle Africa | 4.5 /100 | #236 | Tragic 12.0% |
| Immigrants | Cambodia | 3.9 /100 | #237 | Tragic 12.0% |
| West Indians | 3.7 /100 | #238 | Tragic 12.0% |
| Immigrants | Western Africa | 3.3 /100 | #239 | Tragic 12.0% |
| Immigrants | Thailand | 3.3 /100 | #240 | Tragic 12.0% |
| Mexican American Indians | 3.2 /100 | #241 | Tragic 12.0% |
| Samoans | 2.8 /100 | #242 | Tragic 12.1% |
| Slovaks | 2.7 /100 | #243 | Tragic 12.1% |
| Finns | 2.3 /100 | #244 | Tragic 12.1% |
| Immigrants | Mexico | 2.2 /100 | #245 | Tragic 12.1% |
| Guamanians/Chamorros | 1.4 /100 | #246 | Tragic 12.2% |
| Immigrants | Senegal | 1.3 /100 | #247 | Tragic 12.2% |
| Spaniards | 1.3 /100 | #248 | Tragic 12.3% |
| Hispanics or Latinos | 1.3 /100 | #249 | Tragic 12.3% |
| Immigrants | Burma/Myanmar | 1.2 /100 | #250 | Tragic 12.3% |