Dutch vs Immigrants from Latin America Male Disability
COMPARE
Dutch
Immigrants from Latin America
Male Disability
Male Disability Comparison
Dutch
Immigrants from Latin America
12.7%
MALE DISABILITY
0.0/ 100
METRIC RATING
280th/ 347
METRIC RANK
11.2%
MALE DISABILITY
54.0/ 100
METRIC RATING
168th/ 347
METRIC RANK
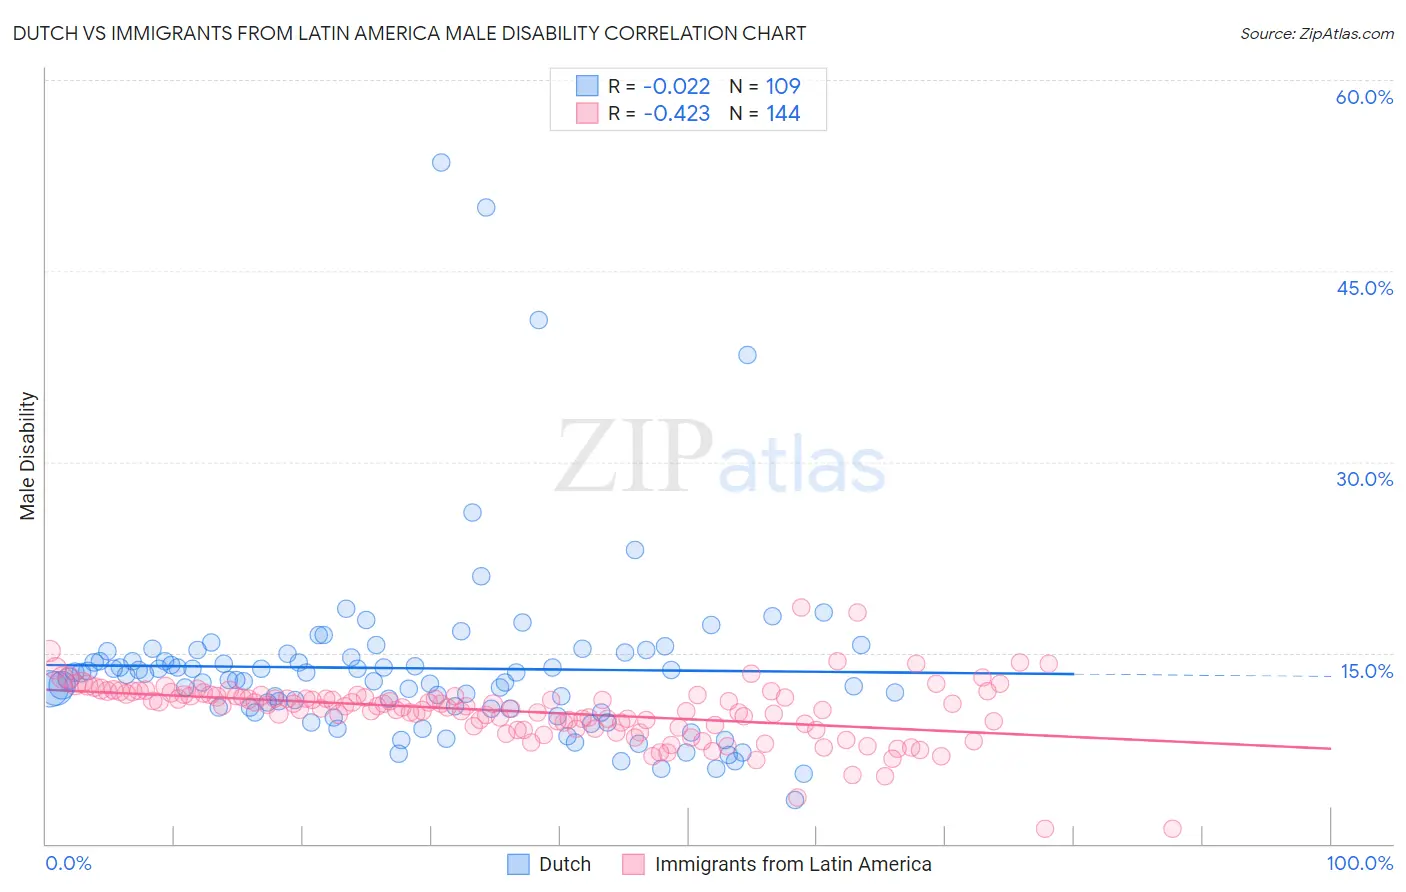
Dutch vs Immigrants from Latin America Male Disability Correlation Chart
The statistical analysis conducted on geographies consisting of 554,174,646 people shows no correlation between the proportion of Dutch and percentage of males with a disability in the United States with a correlation coefficient (R) of -0.022 and weighted average of 12.7%. Similarly, the statistical analysis conducted on geographies consisting of 558,326,856 people shows a moderate negative correlation between the proportion of Immigrants from Latin America and percentage of males with a disability in the United States with a correlation coefficient (R) of -0.423 and weighted average of 11.2%, a difference of 13.5%.
Male Disability Correlation Summary
| Measurement | Dutch | Immigrants from Latin America |
| Minimum | 3.4% | 1.2% |
| Maximum | 53.5% | 18.6% |
| Range | 50.1% | 17.4% |
| Mean | 13.8% | 10.4% |
| Median | 13.0% | 10.8% |
| Interquartile 25% (IQ1) | 10.6% | 9.2% |
| Interquartile 75% (IQ3) | 14.8% | 11.7% |
| Interquartile Range (IQR) | 4.2% | 2.5% |
| Standard Deviation (Sample) | 7.3% | 2.4% |
| Standard Deviation (Population) | 7.3% | 2.4% |
Similar Demographics by Male Disability
Demographics Similar to Dutch by Male Disability
In terms of male disability, the demographic groups most similar to Dutch are Slovak (12.7%, a difference of 0.050%), Sioux (12.7%, a difference of 0.060%), Irish (12.7%, a difference of 0.11%), German (12.7%, a difference of 0.12%), and Central American Indian (12.7%, a difference of 0.20%).
| Demographics | Rating | Rank | Male Disability |
| Native Hawaiians | 0.0 /100 | #273 | Tragic 12.5% |
| Hopi | 0.0 /100 | #274 | Tragic 12.5% |
| Fijians | 0.0 /100 | #275 | Tragic 12.6% |
| Africans | 0.0 /100 | #276 | Tragic 12.6% |
| Finns | 0.0 /100 | #277 | Tragic 12.6% |
| Central American Indians | 0.0 /100 | #278 | Tragic 12.7% |
| Slovaks | 0.0 /100 | #279 | Tragic 12.7% |
| Dutch | 0.0 /100 | #280 | Tragic 12.7% |
| Sioux | 0.0 /100 | #281 | Tragic 12.7% |
| Irish | 0.0 /100 | #282 | Tragic 12.7% |
| Germans | 0.0 /100 | #283 | Tragic 12.7% |
| Spanish | 0.0 /100 | #284 | Tragic 12.7% |
| Welsh | 0.0 /100 | #285 | Tragic 12.7% |
| Scottish | 0.0 /100 | #286 | Tragic 12.8% |
| Cape Verdeans | 0.0 /100 | #287 | Tragic 12.8% |
Demographics Similar to Immigrants from Latin America by Male Disability
In terms of male disability, the demographic groups most similar to Immigrants from Latin America are Immigrants from Southern Europe (11.2%, a difference of 0.020%), Barbadian (11.2%, a difference of 0.030%), New Zealander (11.2%, a difference of 0.060%), Haitian (11.2%, a difference of 0.080%), and Romanian (11.2%, a difference of 0.18%).
| Demographics | Rating | Rank | Male Disability |
| Immigrants | West Indies | 65.7 /100 | #161 | Good 11.1% |
| Immigrants | Haiti | 65.3 /100 | #162 | Good 11.1% |
| Immigrants | Kenya | 63.8 /100 | #163 | Good 11.1% |
| British West Indians | 62.8 /100 | #164 | Good 11.1% |
| Luxembourgers | 61.9 /100 | #165 | Good 11.1% |
| Immigrants | Hungary | 61.2 /100 | #166 | Good 11.1% |
| Immigrants | Southern Europe | 54.4 /100 | #167 | Average 11.2% |
| Immigrants | Latin America | 54.0 /100 | #168 | Average 11.2% |
| Barbadians | 53.4 /100 | #169 | Average 11.2% |
| New Zealanders | 52.9 /100 | #170 | Average 11.2% |
| Haitians | 52.5 /100 | #171 | Average 11.2% |
| Romanians | 50.7 /100 | #172 | Average 11.2% |
| Immigrants | Burma/Myanmar | 50.4 /100 | #173 | Average 11.2% |
| Maltese | 50.0 /100 | #174 | Average 11.2% |
| Immigrants | Honduras | 48.7 /100 | #175 | Average 11.2% |