Immigrants from Saudi Arabia vs Canadian Nursery School
COMPARE
Immigrants from Saudi Arabia
Canadian
Nursery School
Nursery School Comparison
Immigrants from Saudi Arabia
Canadians
98.2%
NURSERY SCHOOL
93.4/ 100
METRIC RATING
127th/ 347
METRIC RANK
98.4%
NURSERY SCHOOL
99.7/ 100
METRIC RATING
66th/ 347
METRIC RANK
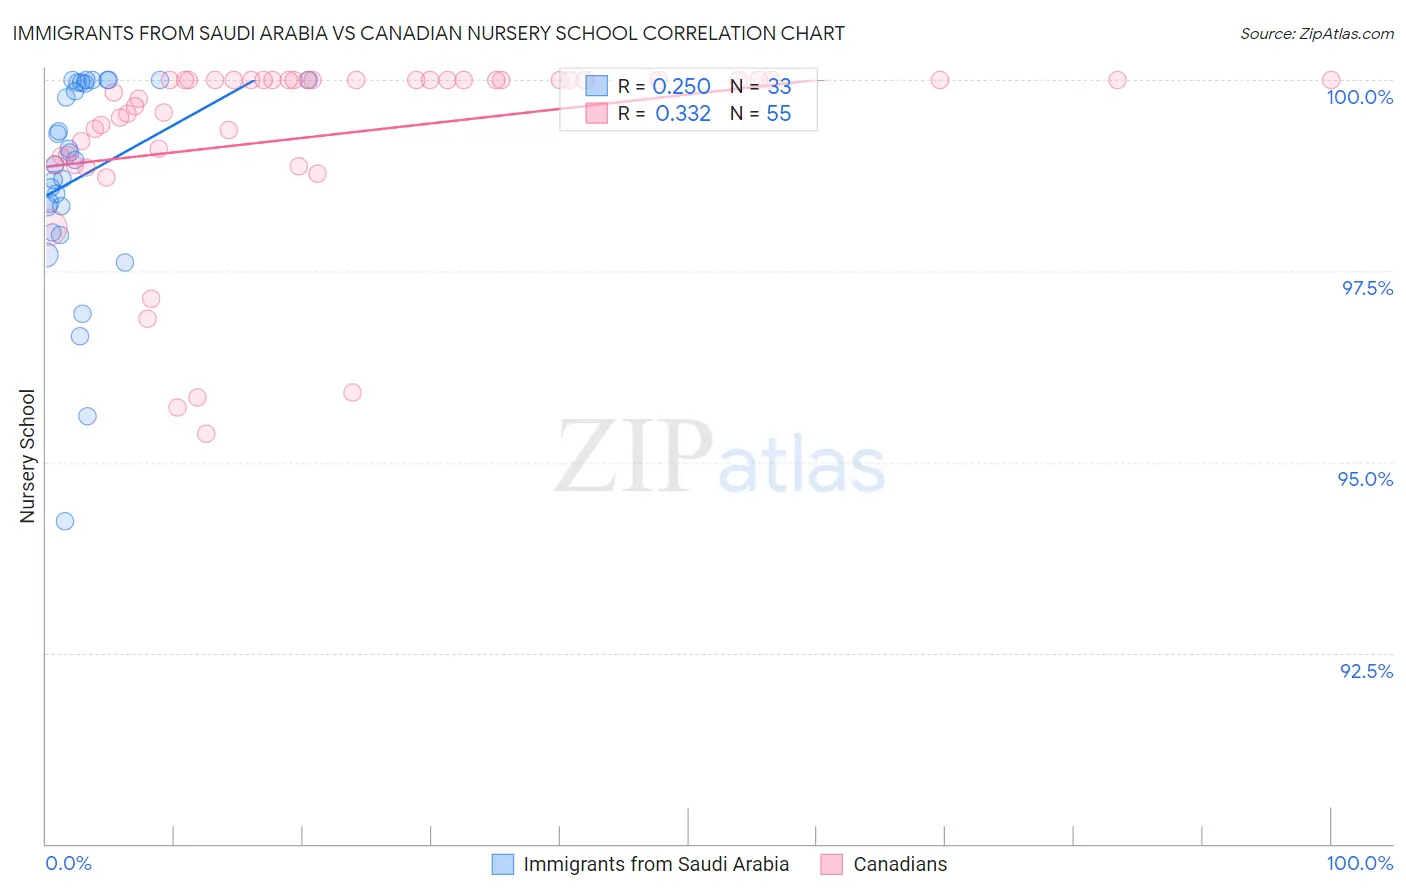
Immigrants from Saudi Arabia vs Canadian Nursery School Correlation Chart
The statistical analysis conducted on geographies consisting of 164,277,573 people shows a weak positive correlation between the proportion of Immigrants from Saudi Arabia and percentage of population with at least nursery school education in the United States with a correlation coefficient (R) of 0.250 and weighted average of 98.2%. Similarly, the statistical analysis conducted on geographies consisting of 437,557,033 people shows a mild positive correlation between the proportion of Canadians and percentage of population with at least nursery school education in the United States with a correlation coefficient (R) of 0.332 and weighted average of 98.4%, a difference of 0.23%.
Nursery School Correlation Summary
| Measurement | Immigrants from Saudi Arabia | Canadian |
| Minimum | 94.2% | 95.4% |
| Maximum | 100.0% | 100.0% |
| Range | 5.8% | 4.6% |
| Mean | 98.7% | 99.3% |
| Median | 98.9% | 100.0% |
| Interquartile 25% (IQ1) | 98.2% | 99.0% |
| Interquartile 75% (IQ3) | 100.0% | 100.0% |
| Interquartile Range (IQR) | 1.8% | 0.99% |
| Standard Deviation (Sample) | 1.4% | 1.2% |
| Standard Deviation (Population) | 1.4% | 1.2% |
Similar Demographics by Nursery School
Demographics Similar to Immigrants from Saudi Arabia by Nursery School
In terms of nursery school, the demographic groups most similar to Immigrants from Saudi Arabia are Lebanese (98.2%, a difference of 0.0%), Iroquois (98.2%, a difference of 0.0%), Menominee (98.2%, a difference of 0.0%), Okinawan (98.2%, a difference of 0.010%), and Immigrants from Zimbabwe (98.2%, a difference of 0.010%).
| Demographics | Rating | Rank | Nursery School |
| Okinawans | 94.5 /100 | #120 | Exceptional 98.2% |
| Immigrants | Zimbabwe | 94.2 /100 | #121 | Exceptional 98.2% |
| Immigrants | Japan | 94.0 /100 | #122 | Exceptional 98.2% |
| Syrians | 93.9 /100 | #123 | Exceptional 98.2% |
| Lebanese | 93.8 /100 | #124 | Exceptional 98.2% |
| Iroquois | 93.7 /100 | #125 | Exceptional 98.2% |
| Menominee | 93.6 /100 | #126 | Exceptional 98.2% |
| Immigrants | Saudi Arabia | 93.4 /100 | #127 | Exceptional 98.2% |
| Immigrants | Serbia | 92.4 /100 | #128 | Exceptional 98.2% |
| Cambodians | 91.4 /100 | #129 | Exceptional 98.2% |
| Immigrants | Croatia | 91.4 /100 | #130 | Exceptional 98.2% |
| Spaniards | 91.1 /100 | #131 | Exceptional 98.2% |
| Seminole | 90.9 /100 | #132 | Exceptional 98.2% |
| Immigrants | Europe | 90.7 /100 | #133 | Exceptional 98.1% |
| Immigrants | Bulgaria | 89.4 /100 | #134 | Excellent 98.1% |
Demographics Similar to Canadians by Nursery School
In terms of nursery school, the demographic groups most similar to Canadians are Immigrants from Northern Europe (98.4%, a difference of 0.0%), Russian (98.4%, a difference of 0.010%), Immigrants from Austria (98.4%, a difference of 0.010%), Cheyenne (98.4%, a difference of 0.010%), and Serbian (98.4%, a difference of 0.010%).
| Demographics | Rating | Rank | Nursery School |
| Immigrants | Canada | 99.8 /100 | #59 | Exceptional 98.4% |
| Slavs | 99.8 /100 | #60 | Exceptional 98.4% |
| New Zealanders | 99.7 /100 | #61 | Exceptional 98.4% |
| Creek | 99.7 /100 | #62 | Exceptional 98.4% |
| Immigrants | North America | 99.7 /100 | #63 | Exceptional 98.4% |
| Greeks | 99.7 /100 | #64 | Exceptional 98.4% |
| Maltese | 99.7 /100 | #65 | Exceptional 98.4% |
| Canadians | 99.7 /100 | #66 | Exceptional 98.4% |
| Immigrants | Northern Europe | 99.6 /100 | #67 | Exceptional 98.4% |
| Russians | 99.6 /100 | #68 | Exceptional 98.4% |
| Immigrants | Austria | 99.6 /100 | #69 | Exceptional 98.4% |
| Cheyenne | 99.6 /100 | #70 | Exceptional 98.4% |
| Serbians | 99.6 /100 | #71 | Exceptional 98.4% |
| Chickasaw | 99.6 /100 | #72 | Exceptional 98.4% |
| Cajuns | 99.4 /100 | #73 | Exceptional 98.4% |