Immigrants from Central America vs Greek Vision Disability
COMPARE
Immigrants from Central America
Greek
Vision Disability
Vision Disability Comparison
Immigrants from Central America
Greeks
2.5%
VISION DISABILITY
0.0/ 100
METRIC RATING
285th/ 347
METRIC RANK
2.1%
VISION DISABILITY
95.1/ 100
METRIC RATING
100th/ 347
METRIC RANK
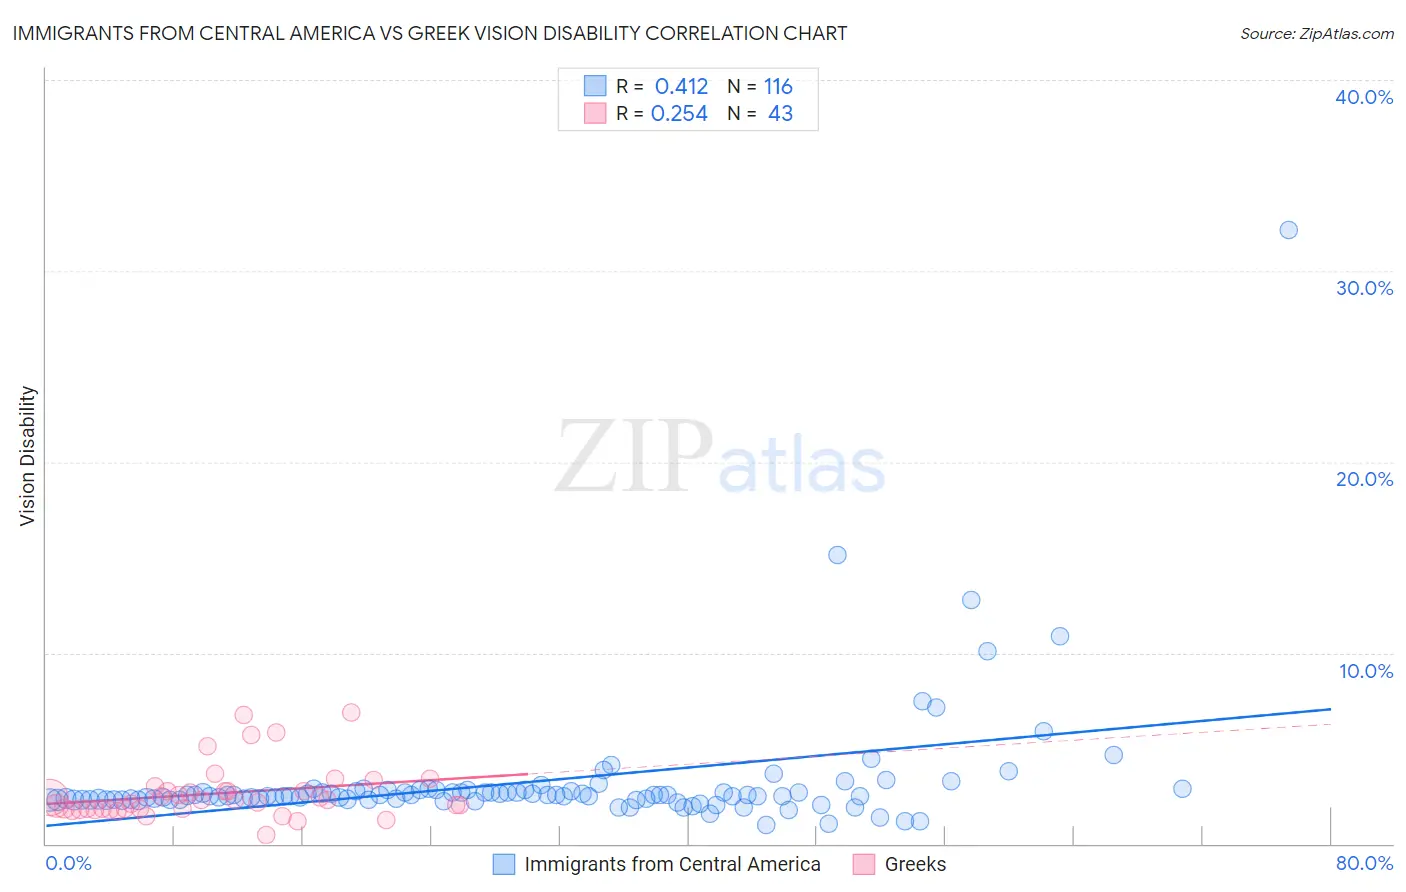
Immigrants from Central America vs Greek Vision Disability Correlation Chart
The statistical analysis conducted on geographies consisting of 535,338,761 people shows a moderate positive correlation between the proportion of Immigrants from Central America and percentage of population with vision disability in the United States with a correlation coefficient (R) of 0.412 and weighted average of 2.5%. Similarly, the statistical analysis conducted on geographies consisting of 482,063,335 people shows a weak positive correlation between the proportion of Greeks and percentage of population with vision disability in the United States with a correlation coefficient (R) of 0.254 and weighted average of 2.1%, a difference of 19.4%.
Vision Disability Correlation Summary
| Measurement | Immigrants from Central America | Greek |
| Minimum | 1.00% | 0.45% |
| Maximum | 32.1% | 6.8% |
| Range | 31.1% | 6.4% |
| Mean | 3.2% | 2.6% |
| Median | 2.5% | 2.3% |
| Interquartile 25% (IQ1) | 2.3% | 1.8% |
| Interquartile 75% (IQ3) | 2.7% | 2.8% |
| Interquartile Range (IQR) | 0.43% | 0.98% |
| Standard Deviation (Sample) | 3.4% | 1.4% |
| Standard Deviation (Population) | 3.4% | 1.4% |
Similar Demographics by Vision Disability
Demographics Similar to Immigrants from Central America by Vision Disability
In terms of vision disability, the demographic groups most similar to Immigrants from Central America are Yakama (2.5%, a difference of 0.010%), Sioux (2.5%, a difference of 0.010%), Honduran (2.5%, a difference of 0.15%), French American Indian (2.5%, a difference of 0.18%), and Puget Sound Salish (2.5%, a difference of 0.30%).
| Demographics | Rating | Rank | Vision Disability |
| Spanish | 0.0 /100 | #278 | Tragic 2.4% |
| Nepalese | 0.0 /100 | #279 | Tragic 2.4% |
| Cape Verdeans | 0.0 /100 | #280 | Tragic 2.4% |
| U.S. Virgin Islanders | 0.0 /100 | #281 | Tragic 2.5% |
| Immigrants | Caribbean | 0.0 /100 | #282 | Tragic 2.5% |
| Puget Sound Salish | 0.0 /100 | #283 | Tragic 2.5% |
| Yakama | 0.0 /100 | #284 | Tragic 2.5% |
| Immigrants | Central America | 0.0 /100 | #285 | Tragic 2.5% |
| Sioux | 0.0 /100 | #286 | Tragic 2.5% |
| Hondurans | 0.0 /100 | #287 | Tragic 2.5% |
| French American Indians | 0.0 /100 | #288 | Tragic 2.5% |
| Immigrants | Nonimmigrants | 0.0 /100 | #289 | Tragic 2.5% |
| Immigrants | Cuba | 0.0 /100 | #290 | Tragic 2.5% |
| Immigrants | Honduras | 0.0 /100 | #291 | Tragic 2.5% |
| Crow | 0.0 /100 | #292 | Tragic 2.5% |
Demographics Similar to Greeks by Vision Disability
In terms of vision disability, the demographic groups most similar to Greeks are Estonian (2.1%, a difference of 0.040%), Albanian (2.1%, a difference of 0.080%), Immigrants from South Africa (2.1%, a difference of 0.11%), Sri Lankan (2.1%, a difference of 0.11%), and Immigrants from Afghanistan (2.1%, a difference of 0.16%).
| Demographics | Rating | Rank | Vision Disability |
| Immigrants | Europe | 96.1 /100 | #93 | Exceptional 2.1% |
| Immigrants | Croatia | 96.0 /100 | #94 | Exceptional 2.1% |
| Australians | 95.9 /100 | #95 | Exceptional 2.1% |
| Romanians | 95.7 /100 | #96 | Exceptional 2.1% |
| Immigrants | Afghanistan | 95.6 /100 | #97 | Exceptional 2.1% |
| Immigrants | South Africa | 95.4 /100 | #98 | Exceptional 2.1% |
| Estonians | 95.3 /100 | #99 | Exceptional 2.1% |
| Greeks | 95.1 /100 | #100 | Exceptional 2.1% |
| Albanians | 94.9 /100 | #101 | Exceptional 2.1% |
| Sri Lankans | 94.8 /100 | #102 | Exceptional 2.1% |
| Immigrants | Austria | 94.4 /100 | #103 | Exceptional 2.1% |
| Immigrants | Italy | 94.4 /100 | #104 | Exceptional 2.1% |
| Carpatho Rusyns | 94.3 /100 | #105 | Exceptional 2.1% |
| Swedes | 94.2 /100 | #106 | Exceptional 2.1% |
| Danes | 94.2 /100 | #107 | Exceptional 2.1% |