Immigrants from Oceania vs Turkish Disability Age 65 to 74

COMPARE

Immigrants from Oceania
Race
Ancestry
AfghanAfricanAlaska NativeAlaskan AthabascanAlbanianAleutAlsatianAmericanApacheArabArapahoArgentineanArmenianAssyrian/Chaldean/SyriacAustralianAustrianBahamianBangladeshiBarbadianBasqueBelgianBelizeanBermudanBhutaneseBlackfeetBolivianBrazilianBritishBritish West IndianBulgarianBurmeseCajunCambodianCanadianCape VerdeanCarpatho RusynCelticCentral AmericanCentral American IndianCherokeeCheyenneChickasawChileanChineseChippewaChoctawColombianColvilleComancheCosta RicanCreeCreekCroatianCrowCubanCypriotCzechCzechoslovakianDanishDelawareDominicanDutchDutch West IndianEastern EuropeanEcuadorianEgyptianEnglishEstonianEthiopianEuropeanFijianFilipinoFinnishFrenchFrench American IndianFrench CanadianGermanGerman RussianGhanaianGreekGuamanian/ChamorroGuatemalanGuyaneseHaitianHmongHonduranHopiHoumaHungarianIcelanderIndian (Asian)IndonesianInupiatIranianIraqiIrishIroquoisIsraeliItalianJamaicanJapaneseJordanianKenyanKiowaKoreanLaotianLatvianLebaneseLiberianLithuanianLumbeeLuxembourgerMacedonianMalaysianMalteseMarshalleseMenomineeMexicanMexican American IndianMongolianMoroccanNative HawaiianNavajoNepaleseNew ZealanderNicaraguanNigerianNorthern EuropeanNorwegianOkinawanOsageOttawaPaiutePakistaniPalestinianPanamanianParaguayanPennsylvania GermanPeruvianPimaPolishPortuguesePotawatomiPuebloPuerto RicanPuget Sound SalishRomanianRussianSalvadoranSamoanScandinavianScotch-IrishScottishSeminoleSenegaleseSerbianShoshoneSierra LeoneanSiouxSlavicSlovakSloveneSomaliSouth AfricanSouth AmericanSouth American IndianSoviet UnionSpaniardSpanishSpanish AmericanSpanish American IndianSri LankanSubsaharan AfricanSudaneseSwedishSwissSyrianTaiwaneseThaiTlingit-HaidaTohono O'OdhamTonganTrinidadian and TobagonianTsimshianU.S. Virgin IslanderUgandanUkrainianUruguayanUteVenezuelanVietnameseWelshWest IndianYakamaYaquiYugoslavianYumanYup'ikZimbabwean
Immigration
NonimmigrantsImmigrantsAfghanistanAfricaAlbaniaArgentinaArmeniaAsiaAustraliaAustriaBahamasBangladeshBarbadosBelarusBelgiumBelizeBoliviaBosnia and HerzegovinaBrazilBulgariaBurma/MyanmarCabo VerdeCambodiaCameroonCanadaCaribbeanCentral AmericaChileChinaColombiaCongoCosta RicaCroatiaCubaCzechoslovakiaDenmarkDominicaDominican RepublicEastern AfricaEastern AsiaEastern EuropeEcuadorEgyptEl SalvadorEnglandEritreaEthiopiaEuropeFijiFranceGermanyGhanaGreeceGrenadaGuatemalaGuyanaHaitiHondurasHong KongHungaryIndiaIndonesiaIranIraqIrelandIsraelItalyJamaicaJapanJordanKazakhstanKenyaKoreaKuwaitLaosLatin AmericaLatviaLebanonLiberiaLithuaniaMalaysiaMexicoMicronesiaMiddle AfricaMoldovaMoroccoNepalNetherlandsNicaraguaNigeriaNorth AmericaNorth MacedoniaNorthern AfricaNorthern EuropeNorwayOceaniaPakistanPanamaPeruPhilippinesPolandPortugalRomaniaRussiaSaudi ArabiaScotlandSenegalSerbiaSierra LeoneSingaporeSomaliaSouth AfricaSouth AmericaSouth Central AsiaSouth Eastern AsiaSouthern EuropeSpainSri LankaSt. Vincent and the GrenadinesSudanSwedenSwitzerlandSyriaTaiwanThailandTrinidad and TobagoTurkeyUgandaUkraineUruguayUzbekistanVenezuelaVietnamWest IndiesWestern AfricaWestern AsiaWestern EuropeYemenZaireZimbabweAzores
Turkish
Race
Ancestry
AfghanAfricanAlaska NativeAlaskan AthabascanAlbanianAleutAlsatianAmericanApacheArabArapahoArgentineanArmenianAssyrian/Chaldean/SyriacAustralianAustrianBahamianBangladeshiBarbadianBasqueBelgianBelizeanBermudanBhutaneseBlackfeetBolivianBrazilianBritishBritish West IndianBulgarianBurmeseCajunCambodianCanadianCape VerdeanCarpatho RusynCelticCentral AmericanCentral American IndianCherokeeCheyenneChickasawChileanChineseChippewaChoctawColombianColvilleComancheCosta RicanCreeCreekCroatianCrowCubanCypriotCzechCzechoslovakianDanishDelawareDominicanDutchDutch West IndianEastern EuropeanEcuadorianEgyptianEnglishEstonianEthiopianEuropeanFijianFilipinoFinnishFrenchFrench American IndianFrench CanadianGermanGerman RussianGhanaianGreekGuamanian/ChamorroGuatemalanGuyaneseHaitianHmongHonduranHopiHoumaHungarianIcelanderIndian (Asian)IndonesianInupiatIranianIraqiIrishIroquoisIsraeliItalianJamaicanJapaneseJordanianKenyanKiowaKoreanLaotianLatvianLebaneseLiberianLithuanianLumbeeLuxembourgerMacedonianMalaysianMalteseMarshalleseMenomineeMexicanMexican American IndianMongolianMoroccanNative HawaiianNavajoNepaleseNew ZealanderNicaraguanNigerianNorthern EuropeanNorwegianOkinawanOsageOttawaPaiutePakistaniPalestinianPanamanianParaguayanPennsylvania GermanPeruvianPimaPolishPortuguesePotawatomiPuebloPuerto RicanPuget Sound SalishRomanianRussianSalvadoranSamoanScandinavianScotch-IrishScottishSeminoleSenegaleseSerbianShoshoneSierra LeoneanSiouxSlavicSlovakSloveneSomaliSouth AfricanSouth AmericanSouth American IndianSoviet UnionSpaniardSpanishSpanish AmericanSpanish American IndianSri LankanSubsaharan AfricanSudaneseSwedishSwissSyrianTaiwaneseThaiTlingit-HaidaTohono O'OdhamTonganTrinidadian and TobagonianTsimshianTurkishU.S. Virgin IslanderUgandanUkrainianUruguayanUteVenezuelanVietnameseWelshWest IndianYakamaYaquiYugoslavianYumanYup'ikZimbabwean
Immigration
NonimmigrantsImmigrantsAfghanistanAfricaAlbaniaArgentinaArmeniaAsiaAustraliaAustriaBahamasBangladeshBarbadosBelarusBelgiumBelizeBoliviaBosnia and HerzegovinaBrazilBulgariaBurma/MyanmarCabo VerdeCambodiaCameroonCanadaCaribbeanCentral AmericaChileChinaColombiaCongoCosta RicaCroatiaCubaCzechoslovakiaDenmarkDominicaDominican RepublicEastern AfricaEastern AsiaEastern EuropeEcuadorEgyptEl SalvadorEnglandEritreaEthiopiaEuropeFijiFranceGermanyGhanaGreeceGrenadaGuatemalaGuyanaHaitiHondurasHong KongHungaryIndiaIndonesiaIranIraqIrelandIsraelItalyJamaicaJapanJordanKazakhstanKenyaKoreaKuwaitLaosLatin AmericaLatviaLebanonLiberiaLithuaniaMalaysiaMexicoMicronesiaMiddle AfricaMoldovaMoroccoNepalNetherlandsNicaraguaNigeriaNorth AmericaNorth MacedoniaNorthern AfricaNorthern EuropeNorwayPakistanPanamaPeruPhilippinesPolandPortugalRomaniaRussiaSaudi ArabiaScotlandSenegalSerbiaSierra LeoneSingaporeSomaliaSouth AfricaSouth AmericaSouth Central AsiaSouth Eastern AsiaSouthern EuropeSpainSri LankaSt. Vincent and the GrenadinesSudanSwedenSwitzerlandSyriaTaiwanThailandTrinidad and TobagoTurkeyUgandaUkraineUruguayUzbekistanVenezuelaVietnamWest IndiesWestern AfricaWestern AsiaWestern EuropeYemenZaireZimbabweAzores
Disability Age 65 to 74
Income
Poverty
Unemployment
Labor Participation
Family Structure
Vehicle Availability
Education Level
Disability

Disability Age 65 to 74 Comparison

Immigrants from Oceania

Turks

Poor
Exceptional
24.0%
DISABILITY AGE 65 TO 74
13.6/ 100
METRIC RATING
214th/ 347
METRIC RANK
21.0%
DISABILITY AGE 65 TO 74
99.9/ 100
METRIC RATING
32nd/ 347
METRIC RANK

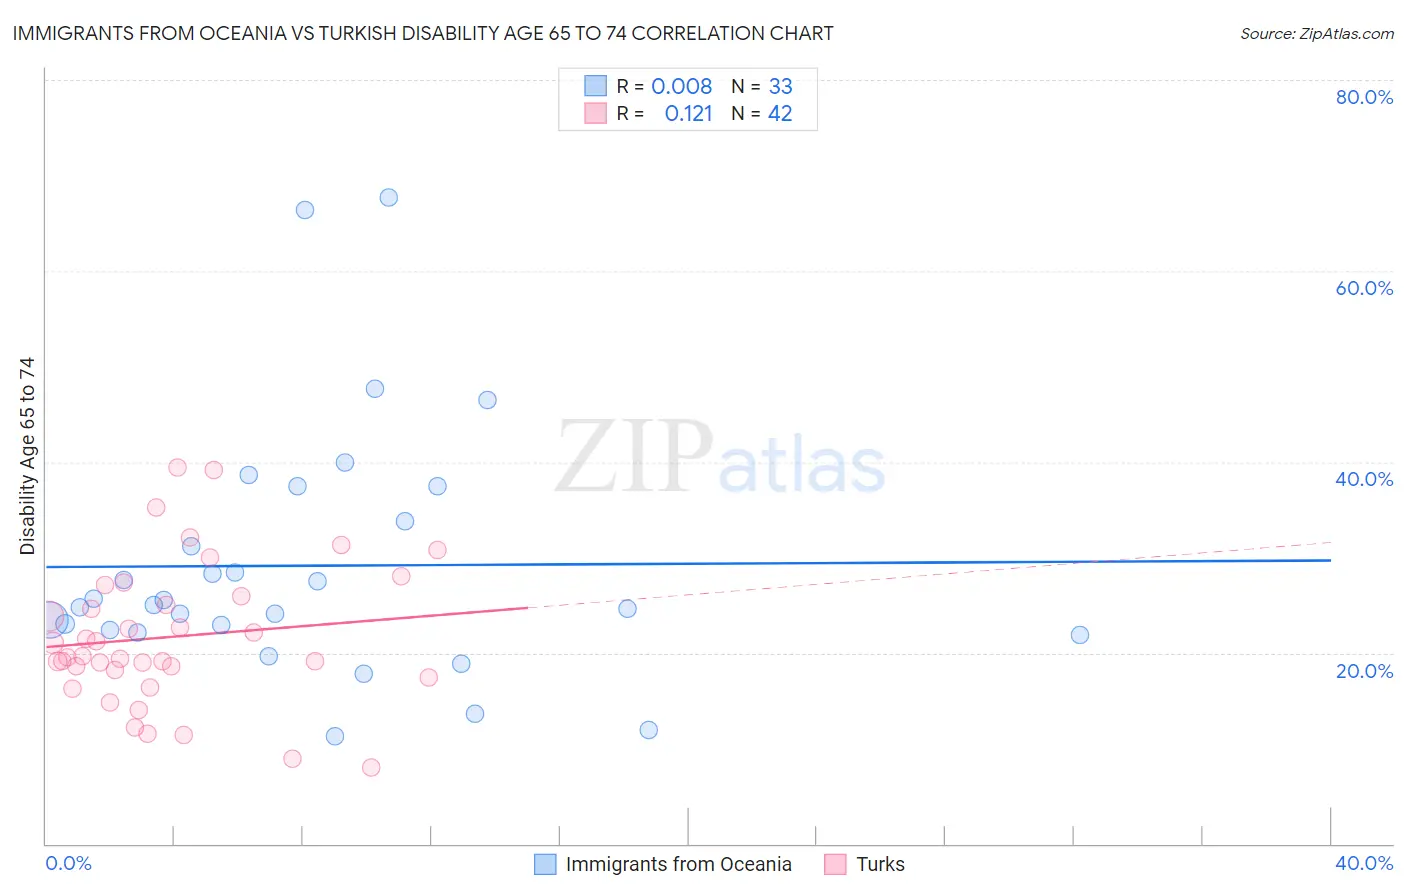
Immigrants from Oceania vs Turkish Disability Age 65 to 74 Correlation Chart

The statistical analysis conducted on geographies consisting of 304,918,832 people shows no correlation between the proportion of Immigrants from Oceania and percentage of population with a disability between the ages 65 and 75 in the United States with a correlation coefficient (R) of 0.008 and weighted average of 24.0%. Similarly, the statistical analysis conducted on geographies consisting of 271,478,779 people shows a poor positive correlation between the proportion of Turks and percentage of population with a disability between the ages 65 and 75 in the United States with a correlation coefficient (R) of 0.121 and weighted average of 21.0%, a difference of 14.0%.
Immigrants from Oceania vs Turkish Disability Age 65 to 74

Disability Age 65 to 74 Correlation Summary

MeasurementImmigrants from OceaniaTurkish
Minimum11.3%7.9%
Maximum67.7%39.4%
Range56.4%31.5%
Mean29.1%21.7%
Median25.1%19.6%
Interquartile 25% (IQ1)22.2%18.2%
Interquartile 75% (IQ3)35.6%26.0%
Interquartile Range (IQR)13.3%7.8%
Standard Deviation (Sample)13.1%7.4%
Standard Deviation (Population)12.9%7.3%

Similar Demographics by Disability Age 65 to 74

Demographics Similar to Immigrants from Oceania by Disability Age 65 to 74

In terms of disability age 65 to 74, the demographic groups most similar to Immigrants from Oceania are Pennsylvania German (24.0%, a difference of 0.040%), Nicaraguan (23.9%, a difference of 0.080%), Jamaican (24.0%, a difference of 0.18%), French (23.9%, a difference of 0.24%), and Immigrants from Portugal (24.0%, a difference of 0.24%).
DemographicsRating | RankDisability Age 65 to 74
Immigrants | Sudan
20.1
/100
|
#207
Fair
23.8%
Immigrants | Barbados
19.6
/100
|
#208
Poor
23.8%
Immigrants | Kenya
19.6
/100
|
#209
Poor
23.8%
Trinidadians and Tobagonians
16.4
/100
|
#210
Poor
23.9%
Immigrants | West Indies
15.9
/100
|
#211
Poor
23.9%
French
15.7
/100
|
#212
Poor
23.9%
Nicaraguans
14.3
/100
|
#213
Poor
23.9%
Immigrants | Oceania
13.6
/100
|
#214
Poor
24.0%
Pennsylvania Germans
13.3
/100
|
#215
Poor
24.0%
Jamaicans
12.2
/100
|
#216
Poor
24.0%
Immigrants | Portugal
11.7
/100
|
#217
Poor
24.0%
Immigrants | Nigeria
11.7
/100
|
#218
Poor
24.0%
Immigrants | Burma/Myanmar
11.6
/100
|
#219
Poor
24.0%
Ghanaians
10.4
/100
|
#220
Poor
24.1%
Immigrants | Nicaragua
9.8
/100
|
#221
Tragic
24.1%

Demographics Similar to Turks by Disability Age 65 to 74

In terms of disability age 65 to 74, the demographic groups most similar to Turks are Immigrants from Northern Europe (21.0%, a difference of 0.030%), Immigrants from Greece (21.0%, a difference of 0.070%), Immigrants from Japan (21.0%, a difference of 0.11%), Immigrants from Czechoslovakia (21.0%, a difference of 0.15%), and Immigrants from Argentina (21.1%, a difference of 0.20%).
DemographicsRating | RankDisability Age 65 to 74
Bolivians
99.9
/100
|
#25
Exceptional
21.0%
Immigrants | Australia
99.9
/100
|
#26
Exceptional
21.0%
Immigrants | Sweden
99.9
/100
|
#27
Exceptional
21.0%
Immigrants | Czechoslovakia
99.9
/100
|
#28
Exceptional
21.0%
Immigrants | Japan
99.9
/100
|
#29
Exceptional
21.0%
Immigrants | Greece
99.9
/100
|
#30
Exceptional
21.0%
Immigrants | Northern Europe
99.9
/100
|
#31
Exceptional
21.0%
Turks
99.9
/100
|
#32
Exceptional
21.0%
Immigrants | Argentina
99.9
/100
|
#33
Exceptional
21.1%
Immigrants | Sri Lanka
99.9
/100
|
#34
Exceptional
21.1%
Bulgarians
99.9
/100
|
#35
Exceptional
21.1%
Immigrants | Switzerland
99.8
/100
|
#36
Exceptional
21.1%
Israelis
99.8
/100
|
#37
Exceptional
21.2%
Russians
99.8
/100
|
#38
Exceptional
21.2%
Argentineans
99.8
/100
|
#39
Exceptional
21.2%