Immigrants from Poland vs Immigrants from Eastern Africa Female Disability
COMPARE
Immigrants from Poland
Immigrants from Eastern Africa
Female Disability
Female Disability Comparison
Immigrants from Poland
Immigrants from Eastern Africa
11.6%
FEMALE DISABILITY
99.6/ 100
METRIC RATING
84th/ 347
METRIC RANK
11.7%
FEMALE DISABILITY
98.3/ 100
METRIC RATING
103rd/ 347
METRIC RANK
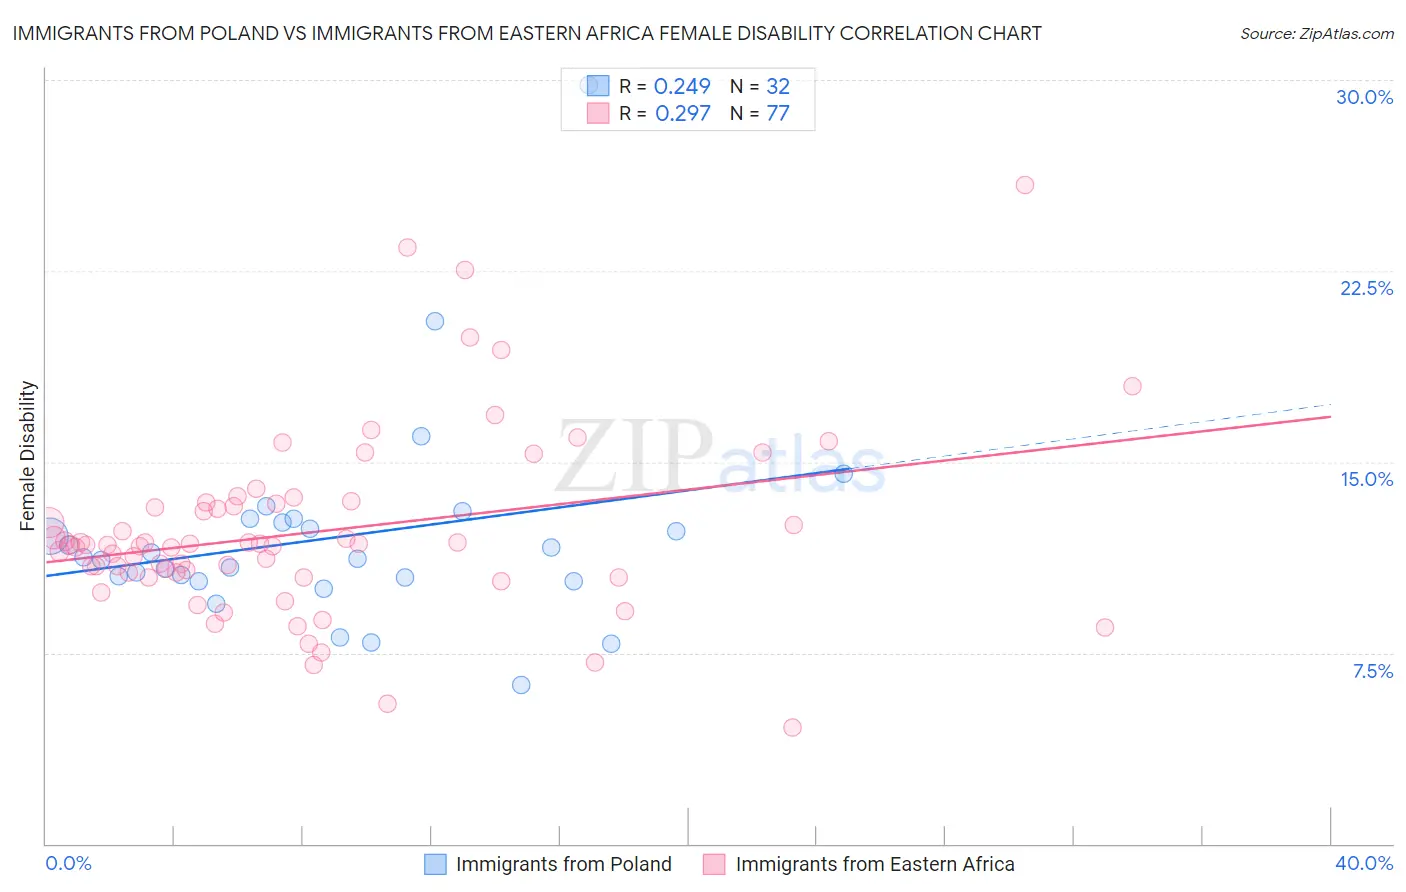
Immigrants from Poland vs Immigrants from Eastern Africa Female Disability Correlation Chart
The statistical analysis conducted on geographies consisting of 304,835,870 people shows a weak positive correlation between the proportion of Immigrants from Poland and percentage of females with a disability in the United States with a correlation coefficient (R) of 0.249 and weighted average of 11.6%. Similarly, the statistical analysis conducted on geographies consisting of 355,100,411 people shows a weak positive correlation between the proportion of Immigrants from Eastern Africa and percentage of females with a disability in the United States with a correlation coefficient (R) of 0.297 and weighted average of 11.7%, a difference of 1.4%.
Female Disability Correlation Summary
| Measurement | Immigrants from Poland | Immigrants from Eastern Africa |
| Minimum | 6.2% | 4.5% |
| Maximum | 29.8% | 25.9% |
| Range | 23.6% | 21.3% |
| Mean | 12.0% | 12.3% |
| Median | 11.2% | 11.7% |
| Interquartile 25% (IQ1) | 10.4% | 10.5% |
| Interquartile 75% (IQ3) | 12.7% | 13.4% |
| Interquartile Range (IQR) | 2.3% | 2.8% |
| Standard Deviation (Sample) | 4.1% | 3.6% |
| Standard Deviation (Population) | 4.1% | 3.6% |
Demographics Similar to Immigrants from Poland and Immigrants from Eastern Africa by Female Disability
In terms of female disability, the demographic groups most similar to Immigrants from Poland are Immigrants from Serbia (11.6%, a difference of 0.030%), Palestinian (11.6%, a difference of 0.030%), Immigrants from Cameroon (11.6%, a difference of 0.040%), Immigrants from Denmark (11.6%, a difference of 0.10%), and Yup'ik (11.6%, a difference of 0.10%). Similarly, the demographic groups most similar to Immigrants from Eastern Africa are Immigrants from South Eastern Asia (11.7%, a difference of 0.070%), Immigrants from Costa Rica (11.7%, a difference of 0.080%), Immigrants from Uruguay (11.7%, a difference of 0.10%), Immigrants from Philippines (11.7%, a difference of 0.15%), and Uruguayan (11.7%, a difference of 0.36%).
| Demographics | Rating | Rank | Female Disability |
| Immigrants | Serbia | 99.6 /100 | #83 | Exceptional 11.6% |
| Immigrants | Poland | 99.6 /100 | #84 | Exceptional 11.6% |
| Palestinians | 99.6 /100 | #85 | Exceptional 11.6% |
| Immigrants | Cameroon | 99.6 /100 | #86 | Exceptional 11.6% |
| Immigrants | Denmark | 99.5 /100 | #87 | Exceptional 11.6% |
| Yup'ik | 99.5 /100 | #88 | Exceptional 11.6% |
| Vietnamese | 99.5 /100 | #89 | Exceptional 11.6% |
| Immigrants | Romania | 99.5 /100 | #90 | Exceptional 11.6% |
| Immigrants | Zimbabwe | 99.5 /100 | #91 | Exceptional 11.6% |
| Immigrants | Czechoslovakia | 99.5 /100 | #92 | Exceptional 11.6% |
| Immigrants | Sierra Leone | 99.4 /100 | #93 | Exceptional 11.6% |
| Immigrants | Brazil | 99.4 /100 | #94 | Exceptional 11.6% |
| Immigrants | Northern Europe | 99.4 /100 | #95 | Exceptional 11.6% |
| Immigrants | Russia | 99.0 /100 | #96 | Exceptional 11.7% |
| Koreans | 99.0 /100 | #97 | Exceptional 11.7% |
| Uruguayans | 98.8 /100 | #98 | Exceptional 11.7% |
| Immigrants | Philippines | 98.6 /100 | #99 | Exceptional 11.7% |
| Immigrants | Uruguay | 98.5 /100 | #100 | Exceptional 11.7% |
| Immigrants | Costa Rica | 98.4 /100 | #101 | Exceptional 11.7% |
| Immigrants | South Eastern Asia | 98.4 /100 | #102 | Exceptional 11.7% |
| Immigrants | Eastern Africa | 98.3 /100 | #103 | Exceptional 11.7% |