Immigrants from Peru vs Fijian 2nd Grade
COMPARE
Immigrants from Peru
Fijian
2nd Grade
2nd Grade Comparison
Immigrants from Peru
Fijians
97.4%
2ND GRADE
0.1/ 100
METRIC RATING
272nd/ 347
METRIC RANK
97.5%
2ND GRADE
0.5/ 100
METRIC RATING
259th/ 347
METRIC RANK
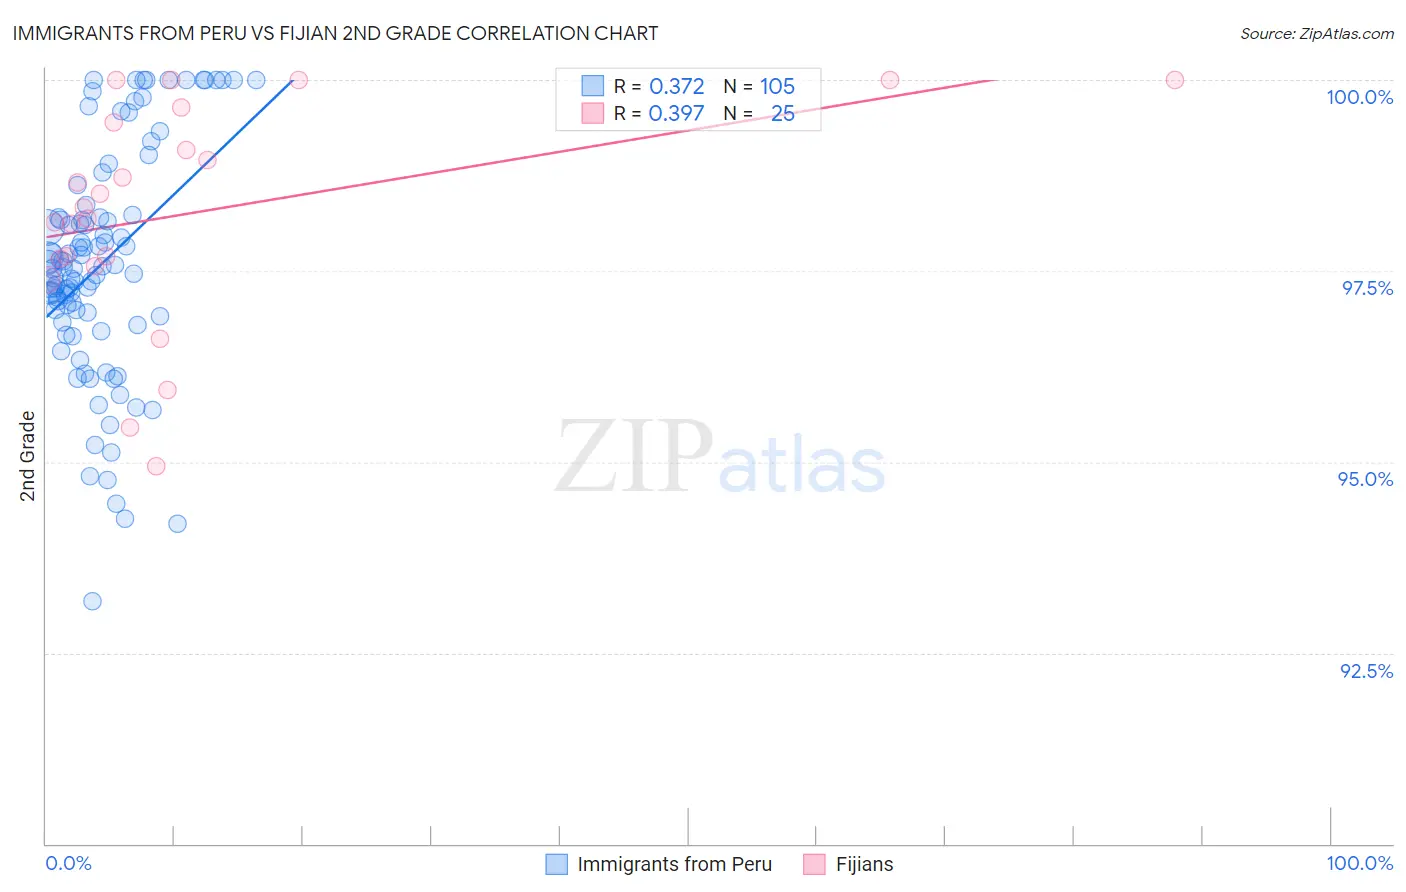
Immigrants from Peru vs Fijian 2nd Grade Correlation Chart
The statistical analysis conducted on geographies consisting of 328,685,754 people shows a mild positive correlation between the proportion of Immigrants from Peru and percentage of population with at least 2nd grade education in the United States with a correlation coefficient (R) of 0.372 and weighted average of 97.4%. Similarly, the statistical analysis conducted on geographies consisting of 55,948,842 people shows a mild positive correlation between the proportion of Fijians and percentage of population with at least 2nd grade education in the United States with a correlation coefficient (R) of 0.397 and weighted average of 97.5%, a difference of 0.090%.
2nd Grade Correlation Summary
| Measurement | Immigrants from Peru | Fijian |
| Minimum | 93.2% | 94.9% |
| Maximum | 100.0% | 100.0% |
| Range | 6.8% | 5.1% |
| Mean | 97.6% | 98.3% |
| Median | 97.5% | 98.3% |
| Interquartile 25% (IQ1) | 96.9% | 97.6% |
| Interquartile 75% (IQ3) | 98.2% | 99.5% |
| Interquartile Range (IQR) | 1.3% | 1.9% |
| Standard Deviation (Sample) | 1.5% | 1.4% |
| Standard Deviation (Population) | 1.5% | 1.4% |
Demographics Similar to Immigrants from Peru and Fijians by 2nd Grade
In terms of 2nd grade, the demographic groups most similar to Immigrants from Peru are Immigrants from Cameroon (97.4%, a difference of 0.010%), Immigrants from Bolivia (97.4%, a difference of 0.010%), Ghanaian (97.4%, a difference of 0.020%), Immigrants from China (97.3%, a difference of 0.020%), and Immigrants from Jamaica (97.4%, a difference of 0.030%). Similarly, the demographic groups most similar to Fijians are Yaqui (97.5%, a difference of 0.0%), Assyrian/Chaldean/Syriac (97.5%, a difference of 0.0%), Immigrants from Congo (97.5%, a difference of 0.010%), Jamaican (97.5%, a difference of 0.010%), and Immigrants from Colombia (97.5%, a difference of 0.010%).
| Demographics | Rating | Rank | 2nd Grade |
| Immigrants | Congo | 0.6 /100 | #255 | Tragic 97.5% |
| Jamaicans | 0.6 /100 | #256 | Tragic 97.5% |
| Immigrants | Colombia | 0.5 /100 | #257 | Tragic 97.5% |
| Yaqui | 0.5 /100 | #258 | Tragic 97.5% |
| Fijians | 0.5 /100 | #259 | Tragic 97.5% |
| Assyrians/Chaldeans/Syriacs | 0.5 /100 | #260 | Tragic 97.5% |
| Armenians | 0.5 /100 | #261 | Tragic 97.5% |
| Taiwanese | 0.4 /100 | #262 | Tragic 97.4% |
| Immigrants | Ethiopia | 0.4 /100 | #263 | Tragic 97.4% |
| Immigrants | Liberia | 0.4 /100 | #264 | Tragic 97.4% |
| Immigrants | South America | 0.4 /100 | #265 | Tragic 97.4% |
| Immigrants | Sierra Leone | 0.4 /100 | #266 | Tragic 97.4% |
| Cubans | 0.3 /100 | #267 | Tragic 97.4% |
| Immigrants | Nigeria | 0.3 /100 | #268 | Tragic 97.4% |
| West Indians | 0.3 /100 | #269 | Tragic 97.4% |
| Immigrants | Jamaica | 0.2 /100 | #270 | Tragic 97.4% |
| Immigrants | Cameroon | 0.2 /100 | #271 | Tragic 97.4% |
| Immigrants | Peru | 0.1 /100 | #272 | Tragic 97.4% |
| Immigrants | Bolivia | 0.1 /100 | #273 | Tragic 97.4% |
| Ghanaians | 0.1 /100 | #274 | Tragic 97.4% |
| Immigrants | China | 0.1 /100 | #275 | Tragic 97.3% |