Immigrants from Panama vs Black/African American Disability Age 65 to 74
COMPARE
Immigrants from Panama
Black/African American
Disability Age 65 to 74
Disability Age 65 to 74 Comparison
Immigrants from Panama
Blacks/African Americans
24.1%
DISABILITY AGE 65 TO 74
8.6/ 100
METRIC RATING
224th/ 347
METRIC RANK
27.3%
DISABILITY AGE 65 TO 74
0.0/ 100
METRIC RATING
306th/ 347
METRIC RANK
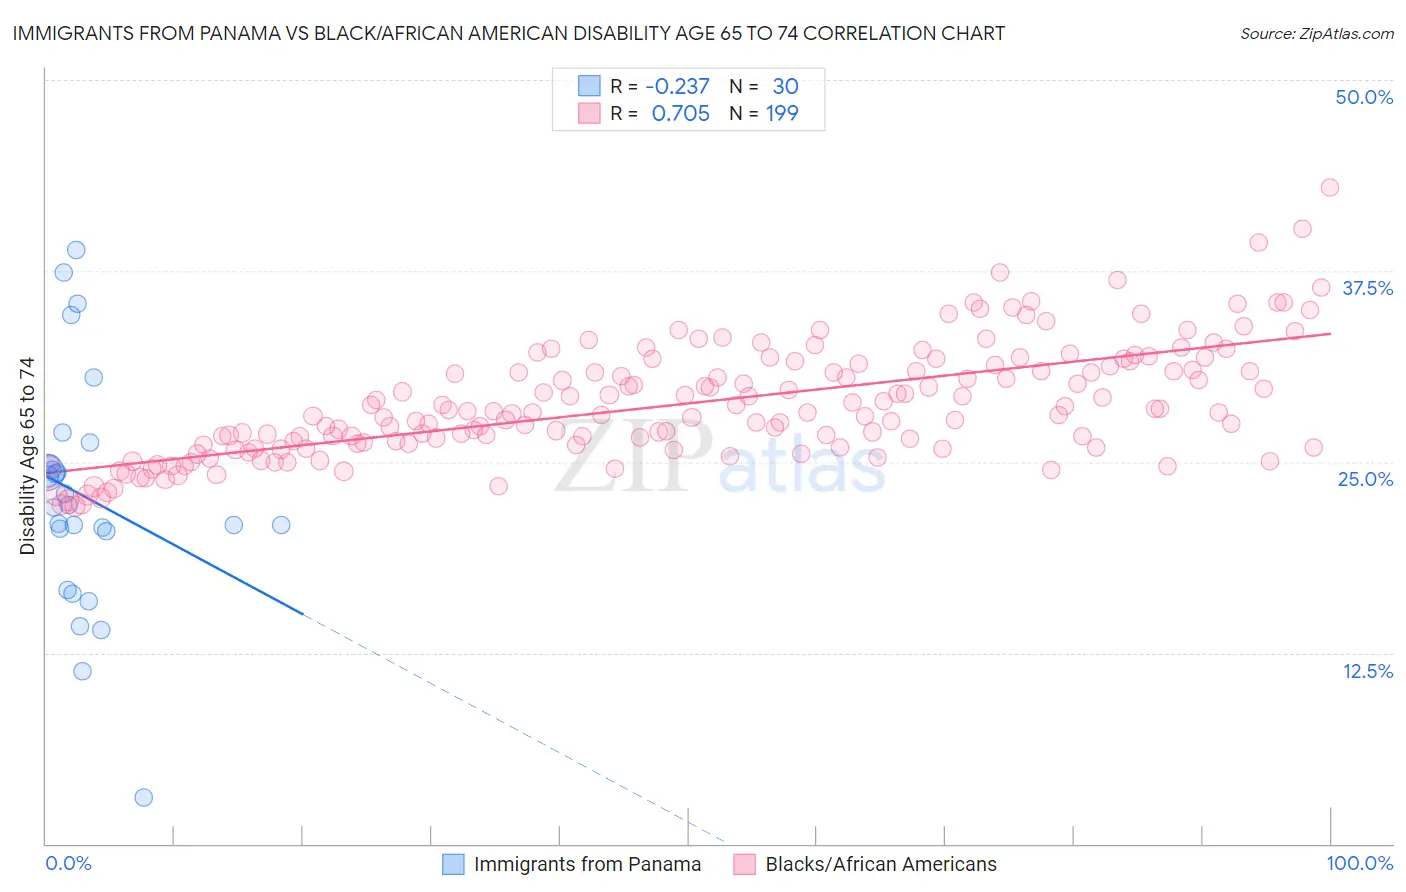
Immigrants from Panama vs Black/African American Disability Age 65 to 74 Correlation Chart
The statistical analysis conducted on geographies consisting of 221,053,627 people shows a weak negative correlation between the proportion of Immigrants from Panama and percentage of population with a disability between the ages 65 and 75 in the United States with a correlation coefficient (R) of -0.237 and weighted average of 24.1%. Similarly, the statistical analysis conducted on geographies consisting of 563,649,388 people shows a strong positive correlation between the proportion of Blacks/African Americans and percentage of population with a disability between the ages 65 and 75 in the United States with a correlation coefficient (R) of 0.705 and weighted average of 27.3%, a difference of 13.1%.
Disability Age 65 to 74 Correlation Summary
| Measurement | Immigrants from Panama | Black/African American |
| Minimum | 3.0% | 22.1% |
| Maximum | 38.9% | 43.0% |
| Range | 35.9% | 20.9% |
| Mean | 22.7% | 28.8% |
| Median | 22.1% | 28.2% |
| Interquartile 25% (IQ1) | 20.4% | 26.1% |
| Interquartile 75% (IQ3) | 24.9% | 31.3% |
| Interquartile Range (IQR) | 4.4% | 5.2% |
| Standard Deviation (Sample) | 7.7% | 3.7% |
| Standard Deviation (Population) | 7.5% | 3.7% |
Similar Demographics by Disability Age 65 to 74
Demographics Similar to Immigrants from Panama by Disability Age 65 to 74
In terms of disability age 65 to 74, the demographic groups most similar to Immigrants from Panama are Immigrants from Middle Africa (24.1%, a difference of 0.050%), Bermudan (24.2%, a difference of 0.090%), Iraqi (24.2%, a difference of 0.090%), Native Hawaiian (24.1%, a difference of 0.12%), and Nigerian (24.2%, a difference of 0.16%).
| Demographics | Rating | Rank | Disability Age 65 to 74 |
| Immigrants | Portugal | 11.7 /100 | #217 | Poor 24.0% |
| Immigrants | Nigeria | 11.7 /100 | #218 | Poor 24.0% |
| Immigrants | Burma/Myanmar | 11.6 /100 | #219 | Poor 24.0% |
| Ghanaians | 10.4 /100 | #220 | Poor 24.1% |
| Immigrants | Nicaragua | 9.8 /100 | #221 | Tragic 24.1% |
| Native Hawaiians | 9.3 /100 | #222 | Tragic 24.1% |
| Immigrants | Middle Africa | 8.9 /100 | #223 | Tragic 24.1% |
| Immigrants | Panama | 8.6 /100 | #224 | Tragic 24.1% |
| Bermudans | 8.2 /100 | #225 | Tragic 24.2% |
| Iraqis | 8.1 /100 | #226 | Tragic 24.2% |
| Nigerians | 7.8 /100 | #227 | Tragic 24.2% |
| Whites/Caucasians | 6.6 /100 | #228 | Tragic 24.2% |
| Celtics | 6.4 /100 | #229 | Tragic 24.2% |
| Barbadians | 6.0 /100 | #230 | Tragic 24.3% |
| Immigrants | Thailand | 5.2 /100 | #231 | Tragic 24.3% |
Demographics Similar to Blacks/African Americans by Disability Age 65 to 74
In terms of disability age 65 to 74, the demographic groups most similar to Blacks/African Americans are Ute (27.3%, a difference of 0.060%), Sioux (27.3%, a difference of 0.21%), Yaqui (27.4%, a difference of 0.27%), Shoshone (27.4%, a difference of 0.32%), and Mexican (27.2%, a difference of 0.40%).
| Demographics | Rating | Rank | Disability Age 65 to 74 |
| Potawatomi | 0.0 /100 | #299 | Tragic 27.0% |
| Immigrants | Dominican Republic | 0.0 /100 | #300 | Tragic 27.0% |
| Immigrants | Mexico | 0.0 /100 | #301 | Tragic 27.1% |
| Central American Indians | 0.0 /100 | #302 | Tragic 27.1% |
| Tlingit-Haida | 0.0 /100 | #303 | Tragic 27.1% |
| Puget Sound Salish | 0.0 /100 | #304 | Tragic 27.2% |
| Mexicans | 0.0 /100 | #305 | Tragic 27.2% |
| Blacks/African Americans | 0.0 /100 | #306 | Tragic 27.3% |
| Ute | 0.0 /100 | #307 | Tragic 27.3% |
| Sioux | 0.0 /100 | #308 | Tragic 27.3% |
| Yaqui | 0.0 /100 | #309 | Tragic 27.4% |
| Shoshone | 0.0 /100 | #310 | Tragic 27.4% |
| Menominee | 0.0 /100 | #311 | Tragic 27.4% |
| Osage | 0.0 /100 | #312 | Tragic 27.5% |
| Paiute | 0.0 /100 | #313 | Tragic 27.8% |