Immigrants from Italy vs Mongolian Hearing Disability
COMPARE
Immigrants from Italy
Mongolian
Hearing Disability
Hearing Disability Comparison
Immigrants from Italy
Mongolians
3.0%
HEARING DISABILITY
41.1/ 100
METRIC RATING
182nd/ 347
METRIC RANK
2.7%
HEARING DISABILITY
97.4/ 100
METRIC RATING
78th/ 347
METRIC RANK
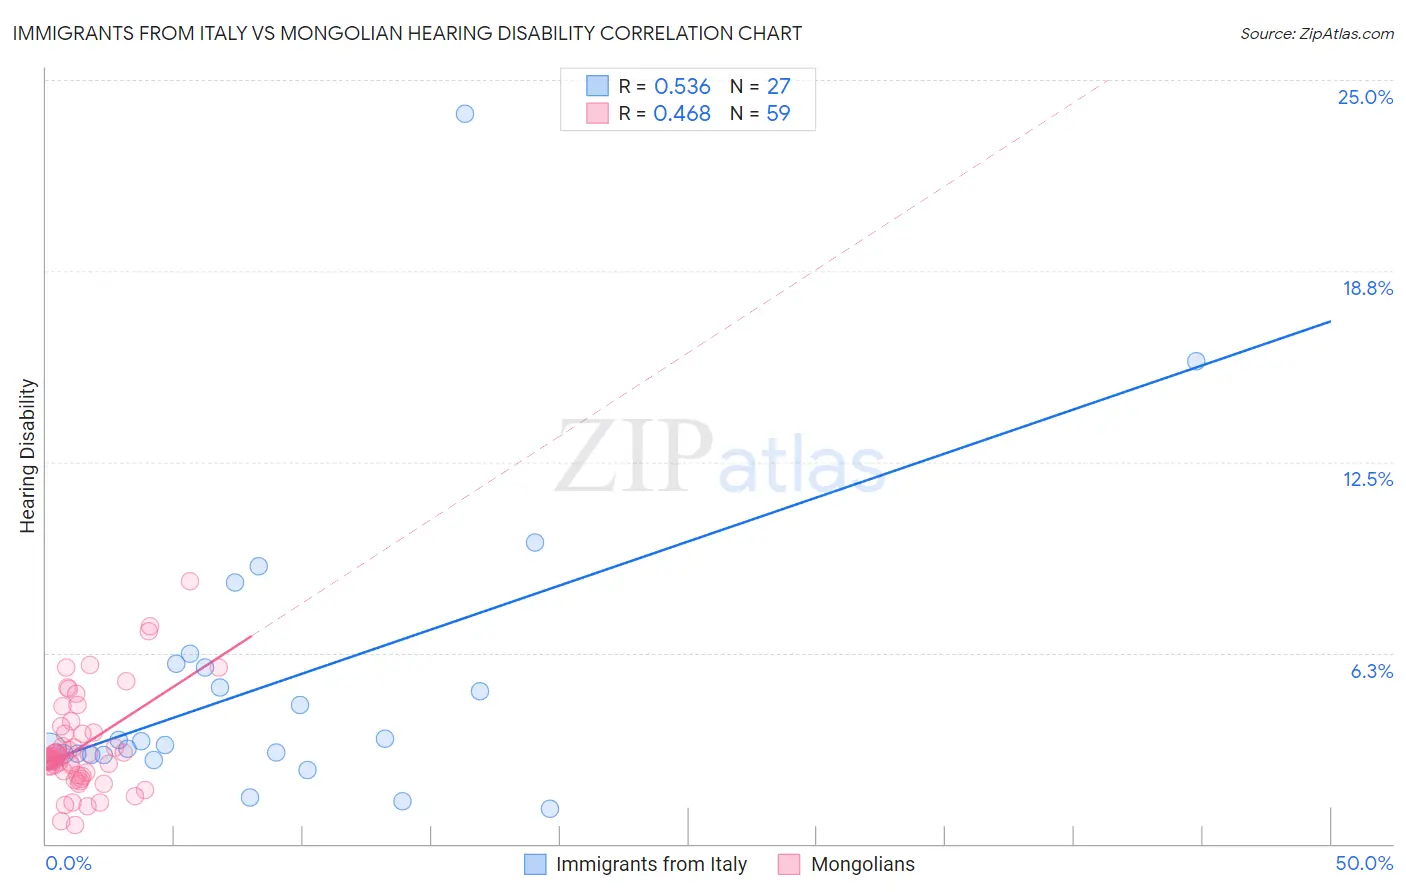
Immigrants from Italy vs Mongolian Hearing Disability Correlation Chart
The statistical analysis conducted on geographies consisting of 324,155,277 people shows a substantial positive correlation between the proportion of Immigrants from Italy and percentage of population with hearing disability in the United States with a correlation coefficient (R) of 0.536 and weighted average of 3.0%. Similarly, the statistical analysis conducted on geographies consisting of 140,352,505 people shows a moderate positive correlation between the proportion of Mongolians and percentage of population with hearing disability in the United States with a correlation coefficient (R) of 0.468 and weighted average of 2.7%, a difference of 10.3%.
Hearing Disability Correlation Summary
| Measurement | Immigrants from Italy | Mongolian |
| Minimum | 1.1% | 0.63% |
| Maximum | 23.9% | 8.6% |
| Range | 22.8% | 8.0% |
| Mean | 5.3% | 3.2% |
| Median | 3.3% | 2.8% |
| Interquartile 25% (IQ1) | 2.9% | 2.3% |
| Interquartile 75% (IQ3) | 5.9% | 3.6% |
| Interquartile Range (IQR) | 3.0% | 1.4% |
| Standard Deviation (Sample) | 4.9% | 1.6% |
| Standard Deviation (Population) | 4.8% | 1.6% |
Similar Demographics by Hearing Disability
Demographics Similar to Immigrants from Italy by Hearing Disability
In terms of hearing disability, the demographic groups most similar to Immigrants from Italy are Immigrants from Belgium (3.0%, a difference of 0.030%), Immigrants from Sweden (3.0%, a difference of 0.12%), Bulgarian (3.0%, a difference of 0.14%), Immigrants from Moldova (3.0%, a difference of 0.18%), and Immigrants from Ireland (3.0%, a difference of 0.37%).
| Demographics | Rating | Rank | Hearing Disability |
| Immigrants | Romania | 48.4 /100 | #175 | Average 3.0% |
| Panamanians | 47.0 /100 | #176 | Average 3.0% |
| Immigrants | Philippines | 46.4 /100 | #177 | Average 3.0% |
| Japanese | 46.0 /100 | #178 | Average 3.0% |
| Immigrants | Moldova | 43.1 /100 | #179 | Average 3.0% |
| Immigrants | Sweden | 42.4 /100 | #180 | Average 3.0% |
| Immigrants | Belgium | 41.5 /100 | #181 | Average 3.0% |
| Immigrants | Italy | 41.1 /100 | #182 | Average 3.0% |
| Bulgarians | 39.7 /100 | #183 | Fair 3.0% |
| Immigrants | Ireland | 37.4 /100 | #184 | Fair 3.0% |
| Immigrants | Southern Europe | 35.3 /100 | #185 | Fair 3.0% |
| Immigrants | Mexico | 34.9 /100 | #186 | Fair 3.0% |
| Blacks/African Americans | 34.7 /100 | #187 | Fair 3.0% |
| Mexican American Indians | 34.7 /100 | #188 | Fair 3.0% |
| Africans | 32.9 /100 | #189 | Fair 3.0% |
Demographics Similar to Mongolians by Hearing Disability
In terms of hearing disability, the demographic groups most similar to Mongolians are Colombian (2.7%, a difference of 0.020%), Immigrants from Malaysia (2.7%, a difference of 0.040%), Immigrants from Saudi Arabia (2.7%, a difference of 0.070%), Asian (2.7%, a difference of 0.070%), and Immigrants from Korea (2.7%, a difference of 0.090%).
| Demographics | Rating | Rank | Hearing Disability |
| Central Americans | 97.7 /100 | #71 | Exceptional 2.7% |
| Afghans | 97.6 /100 | #72 | Exceptional 2.7% |
| Argentineans | 97.5 /100 | #73 | Exceptional 2.7% |
| Immigrants | Korea | 97.5 /100 | #74 | Exceptional 2.7% |
| Immigrants | Saudi Arabia | 97.5 /100 | #75 | Exceptional 2.7% |
| Asians | 97.5 /100 | #76 | Exceptional 2.7% |
| Immigrants | Malaysia | 97.5 /100 | #77 | Exceptional 2.7% |
| Mongolians | 97.4 /100 | #78 | Exceptional 2.7% |
| Colombians | 97.4 /100 | #79 | Exceptional 2.7% |
| Immigrants | Asia | 97.2 /100 | #80 | Exceptional 2.7% |
| Immigrants | Uruguay | 97.2 /100 | #81 | Exceptional 2.7% |
| Immigrants | Armenia | 97.2 /100 | #82 | Exceptional 2.7% |
| Immigrants | Cuba | 97.2 /100 | #83 | Exceptional 2.7% |
| Immigrants | Argentina | 97.0 /100 | #84 | Exceptional 2.8% |
| Immigrants | Northern Africa | 96.9 /100 | #85 | Exceptional 2.8% |