Immigrants from Senegal vs Luxembourger Cognitive Disability
COMPARE
Immigrants from Senegal
Luxembourger
Cognitive Disability
Cognitive Disability Comparison
Immigrants from Senegal
Luxembourgers
18.7%
COGNITIVE DISABILITY
0.0/ 100
METRIC RATING
326th/ 347
METRIC RANK
16.4%
COGNITIVE DISABILITY
99.9/ 100
METRIC RATING
25th/ 347
METRIC RANK
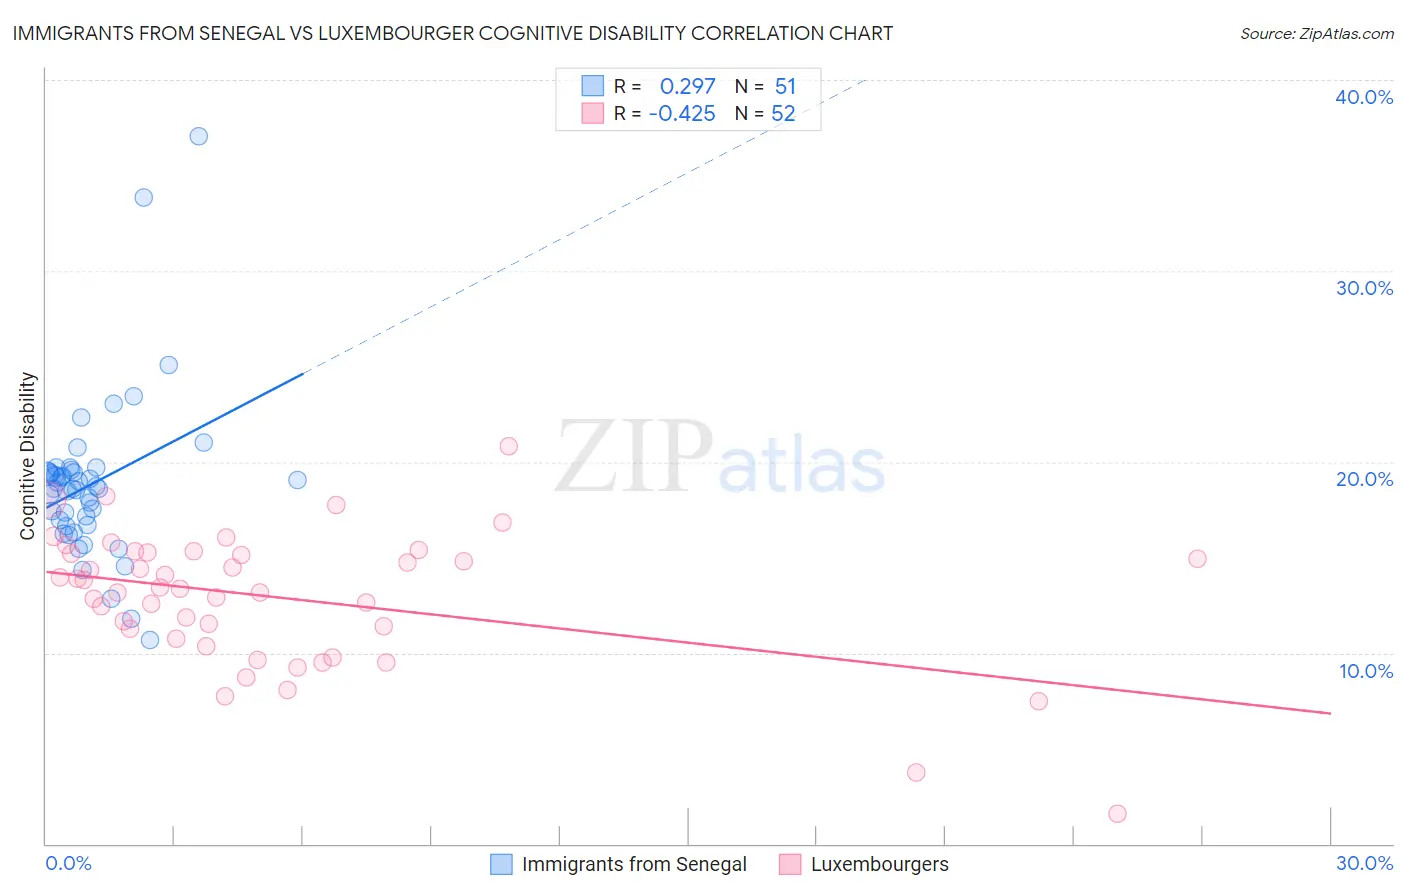
Immigrants from Senegal vs Luxembourger Cognitive Disability Correlation Chart
The statistical analysis conducted on geographies consisting of 90,129,295 people shows a weak positive correlation between the proportion of Immigrants from Senegal and percentage of population with cognitive disability in the United States with a correlation coefficient (R) of 0.297 and weighted average of 18.7%. Similarly, the statistical analysis conducted on geographies consisting of 144,680,571 people shows a moderate negative correlation between the proportion of Luxembourgers and percentage of population with cognitive disability in the United States with a correlation coefficient (R) of -0.425 and weighted average of 16.4%, a difference of 14.2%.
Cognitive Disability Correlation Summary
| Measurement | Immigrants from Senegal | Luxembourger |
| Minimum | 10.7% | 1.6% |
| Maximum | 37.0% | 20.8% |
| Range | 26.4% | 19.3% |
| Mean | 18.8% | 12.9% |
| Median | 18.6% | 13.4% |
| Interquartile 25% (IQ1) | 16.7% | 11.0% |
| Interquartile 75% (IQ3) | 19.5% | 15.2% |
| Interquartile Range (IQR) | 2.8% | 4.2% |
| Standard Deviation (Sample) | 4.3% | 3.5% |
| Standard Deviation (Population) | 4.3% | 3.5% |
Similar Demographics by Cognitive Disability
Demographics Similar to Immigrants from Senegal by Cognitive Disability
In terms of cognitive disability, the demographic groups most similar to Immigrants from Senegal are Indonesian (18.7%, a difference of 0.020%), U.S. Virgin Islander (18.7%, a difference of 0.040%), Dominican (18.7%, a difference of 0.10%), Kiowa (18.7%, a difference of 0.10%), and Pueblo (18.7%, a difference of 0.22%).
| Demographics | Rating | Rank | Cognitive Disability |
| Comanche | 0.0 /100 | #319 | Tragic 18.6% |
| Apache | 0.0 /100 | #320 | Tragic 18.6% |
| Africans | 0.0 /100 | #321 | Tragic 18.6% |
| Immigrants | Liberia | 0.0 /100 | #322 | Tragic 18.7% |
| Pueblo | 0.0 /100 | #323 | Tragic 18.7% |
| Dominicans | 0.0 /100 | #324 | Tragic 18.7% |
| Indonesians | 0.0 /100 | #325 | Tragic 18.7% |
| Immigrants | Senegal | 0.0 /100 | #326 | Tragic 18.7% |
| U.S. Virgin Islanders | 0.0 /100 | #327 | Tragic 18.7% |
| Kiowa | 0.0 /100 | #328 | Tragic 18.7% |
| Navajo | 0.0 /100 | #329 | Tragic 18.8% |
| Immigrants | Dominican Republic | 0.0 /100 | #330 | Tragic 18.8% |
| Pima | 0.0 /100 | #331 | Tragic 18.8% |
| Immigrants | Sudan | 0.0 /100 | #332 | Tragic 18.8% |
| Immigrants | Yemen | 0.0 /100 | #333 | Tragic 18.8% |
Demographics Similar to Luxembourgers by Cognitive Disability
In terms of cognitive disability, the demographic groups most similar to Luxembourgers are Immigrants from Croatia (16.4%, a difference of 0.030%), Immigrants from Argentina (16.4%, a difference of 0.040%), Immigrants from Pakistan (16.4%, a difference of 0.050%), Polish (16.4%, a difference of 0.050%), and Croatian (16.4%, a difference of 0.060%).
| Demographics | Rating | Rank | Cognitive Disability |
| Immigrants | Northern Europe | 100.0 /100 | #18 | Exceptional 16.3% |
| Immigrants | Bolivia | 100.0 /100 | #19 | Exceptional 16.3% |
| Bulgarians | 100.0 /100 | #20 | Exceptional 16.3% |
| Immigrants | Cuba | 100.0 /100 | #21 | Exceptional 16.3% |
| Immigrants | South Central Asia | 99.9 /100 | #22 | Exceptional 16.4% |
| Croatians | 99.9 /100 | #23 | Exceptional 16.4% |
| Immigrants | Argentina | 99.9 /100 | #24 | Exceptional 16.4% |
| Luxembourgers | 99.9 /100 | #25 | Exceptional 16.4% |
| Immigrants | Croatia | 99.9 /100 | #26 | Exceptional 16.4% |
| Immigrants | Pakistan | 99.9 /100 | #27 | Exceptional 16.4% |
| Poles | 99.9 /100 | #28 | Exceptional 16.4% |
| Filipinos | 99.9 /100 | #29 | Exceptional 16.4% |
| Czechs | 99.9 /100 | #30 | Exceptional 16.4% |
| Immigrants | Romania | 99.9 /100 | #31 | Exceptional 16.4% |
| Immigrants | Israel | 99.9 /100 | #32 | Exceptional 16.4% |