Immigrants from North Macedonia vs Tlingit-Haida High School Diploma
COMPARE
Immigrants from North Macedonia
Tlingit-Haida
High School Diploma
High School Diploma Comparison
Immigrants from North Macedonia
Tlingit-Haida
90.5%
HIGH SCHOOL DIPLOMA
98.1/ 100
METRIC RATING
100th/ 347
METRIC RANK
91.4%
HIGH SCHOOL DIPLOMA
99.9/ 100
METRIC RATING
28th/ 347
METRIC RANK
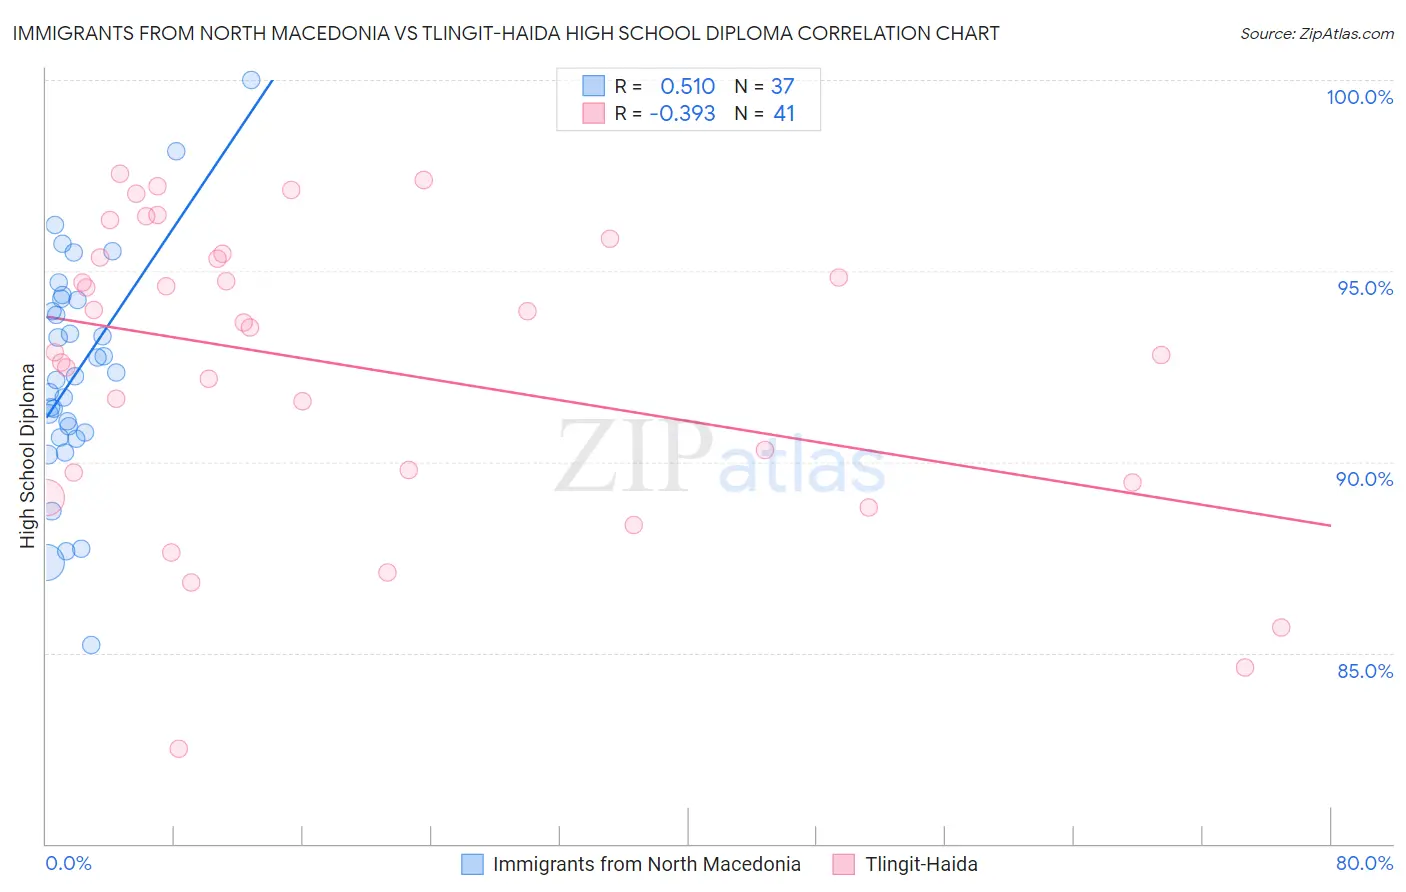
Immigrants from North Macedonia vs Tlingit-Haida High School Diploma Correlation Chart
The statistical analysis conducted on geographies consisting of 74,300,344 people shows a substantial positive correlation between the proportion of Immigrants from North Macedonia and percentage of population with at least high school diploma education in the United States with a correlation coefficient (R) of 0.510 and weighted average of 90.5%. Similarly, the statistical analysis conducted on geographies consisting of 60,871,919 people shows a mild negative correlation between the proportion of Tlingit-Haida and percentage of population with at least high school diploma education in the United States with a correlation coefficient (R) of -0.393 and weighted average of 91.4%, a difference of 1.1%.
High School Diploma Correlation Summary
| Measurement | Immigrants from North Macedonia | Tlingit-Haida |
| Minimum | 85.2% | 82.5% |
| Maximum | 100.0% | 97.5% |
| Range | 14.8% | 15.0% |
| Mean | 92.4% | 92.5% |
| Median | 92.2% | 93.5% |
| Interquartile 25% (IQ1) | 90.7% | 89.6% |
| Interquartile 75% (IQ3) | 94.3% | 95.4% |
| Interquartile Range (IQR) | 3.6% | 5.8% |
| Standard Deviation (Sample) | 3.0% | 3.9% |
| Standard Deviation (Population) | 2.9% | 3.8% |
Similar Demographics by High School Diploma
Demographics Similar to Immigrants from North Macedonia by High School Diploma
In terms of high school diploma, the demographic groups most similar to Immigrants from North Macedonia are Immigrants from Europe (90.5%, a difference of 0.010%), Immigrants from Norway (90.5%, a difference of 0.020%), Immigrants from Kuwait (90.5%, a difference of 0.030%), Immigrants from Korea (90.5%, a difference of 0.030%), and Aleut (90.4%, a difference of 0.030%).
| Demographics | Rating | Rank | High School Diploma |
| Immigrants | Western Europe | 98.6 /100 | #93 | Exceptional 90.6% |
| Immigrants | Israel | 98.5 /100 | #94 | Exceptional 90.5% |
| Icelanders | 98.5 /100 | #95 | Exceptional 90.5% |
| Immigrants | Serbia | 98.4 /100 | #96 | Exceptional 90.5% |
| Immigrants | Kuwait | 98.3 /100 | #97 | Exceptional 90.5% |
| Immigrants | Korea | 98.3 /100 | #98 | Exceptional 90.5% |
| Immigrants | Europe | 98.2 /100 | #99 | Exceptional 90.5% |
| Immigrants | North Macedonia | 98.1 /100 | #100 | Exceptional 90.5% |
| Immigrants | Norway | 98.0 /100 | #101 | Exceptional 90.5% |
| Aleuts | 98.0 /100 | #102 | Exceptional 90.4% |
| Immigrants | Romania | 97.8 /100 | #103 | Exceptional 90.4% |
| Immigrants | Croatia | 97.8 /100 | #104 | Exceptional 90.4% |
| Lebanese | 97.4 /100 | #105 | Exceptional 90.4% |
| Syrians | 97.0 /100 | #106 | Exceptional 90.3% |
| Immigrants | Russia | 96.9 /100 | #107 | Exceptional 90.3% |
Demographics Similar to Tlingit-Haida by High School Diploma
In terms of high school diploma, the demographic groups most similar to Tlingit-Haida are European (91.4%, a difference of 0.020%), Cypriot (91.5%, a difference of 0.030%), Iranian (91.4%, a difference of 0.030%), Immigrants from Northern Europe (91.4%, a difference of 0.030%), and English (91.4%, a difference of 0.040%).
| Demographics | Rating | Rank | High School Diploma |
| Filipinos | 99.9 /100 | #21 | Exceptional 91.6% |
| Estonians | 99.9 /100 | #22 | Exceptional 91.6% |
| Scandinavians | 99.9 /100 | #23 | Exceptional 91.5% |
| Italians | 99.9 /100 | #24 | Exceptional 91.5% |
| Thais | 99.9 /100 | #25 | Exceptional 91.5% |
| Russians | 99.9 /100 | #26 | Exceptional 91.5% |
| Cypriots | 99.9 /100 | #27 | Exceptional 91.5% |
| Tlingit-Haida | 99.9 /100 | #28 | Exceptional 91.4% |
| Europeans | 99.9 /100 | #29 | Exceptional 91.4% |
| Iranians | 99.9 /100 | #30 | Exceptional 91.4% |
| Immigrants | Northern Europe | 99.9 /100 | #31 | Exceptional 91.4% |
| English | 99.9 /100 | #32 | Exceptional 91.4% |
| Okinawans | 99.9 /100 | #33 | Exceptional 91.4% |
| Scottish | 99.9 /100 | #34 | Exceptional 91.4% |
| Irish | 99.9 /100 | #35 | Exceptional 91.4% |