Immigrants from Nicaragua vs French Canadian Disability Age 35 to 64
COMPARE
Immigrants from Nicaragua
French Canadian
Disability Age 35 to 64
Disability Age 35 to 64 Comparison
Immigrants from Nicaragua
French Canadians
10.1%
DISABILITY AGE 35 TO 64
99.5/ 100
METRIC RATING
70th/ 347
METRIC RANK
12.9%
DISABILITY AGE 35 TO 64
0.1/ 100
METRIC RATING
278th/ 347
METRIC RANK
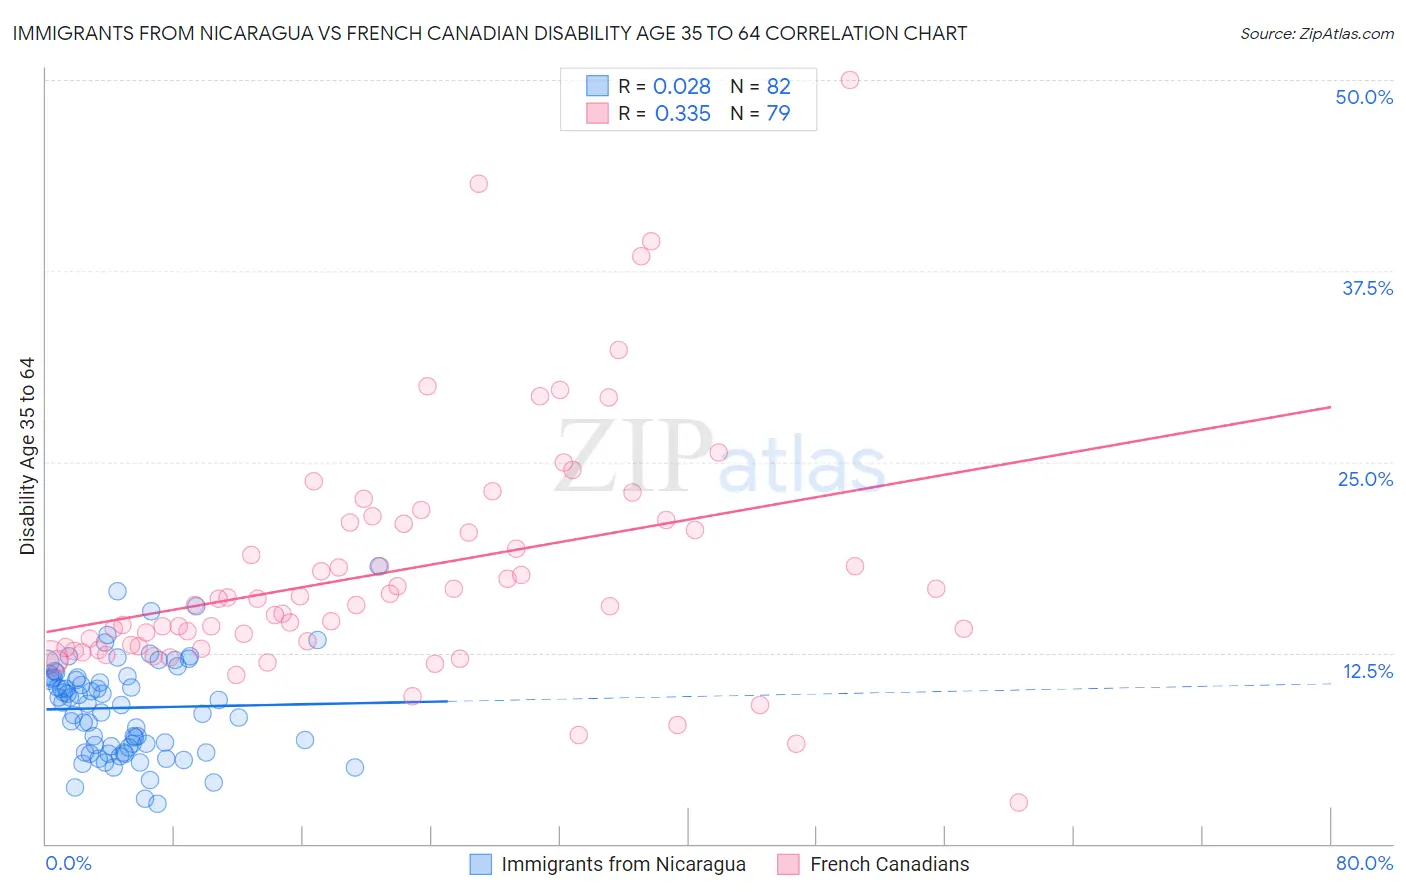
Immigrants from Nicaragua vs French Canadian Disability Age 35 to 64 Correlation Chart
The statistical analysis conducted on geographies consisting of 236,317,781 people shows no correlation between the proportion of Immigrants from Nicaragua and percentage of population with a disability between the ages 34 and 64 in the United States with a correlation coefficient (R) of 0.028 and weighted average of 10.1%. Similarly, the statistical analysis conducted on geographies consisting of 502,069,679 people shows a mild positive correlation between the proportion of French Canadians and percentage of population with a disability between the ages 34 and 64 in the United States with a correlation coefficient (R) of 0.335 and weighted average of 12.9%, a difference of 28.2%.
Disability Age 35 to 64 Correlation Summary
| Measurement | Immigrants from Nicaragua | French Canadian |
| Minimum | 2.6% | 2.7% |
| Maximum | 18.2% | 50.0% |
| Range | 15.6% | 47.3% |
| Mean | 8.9% | 17.9% |
| Median | 9.2% | 15.6% |
| Interquartile 25% (IQ1) | 6.3% | 12.8% |
| Interquartile 75% (IQ3) | 10.9% | 21.0% |
| Interquartile Range (IQR) | 4.6% | 8.2% |
| Standard Deviation (Sample) | 3.2% | 8.1% |
| Standard Deviation (Population) | 3.2% | 8.1% |
Similar Demographics by Disability Age 35 to 64
Demographics Similar to Immigrants from Nicaragua by Disability Age 35 to 64
In terms of disability age 35 to 64, the demographic groups most similar to Immigrants from Nicaragua are Immigrants from Kazakhstan (10.1%, a difference of 0.010%), Immigrants from Eastern Europe (10.1%, a difference of 0.020%), Immigrants from Switzerland (10.1%, a difference of 0.030%), Immigrants from Uzbekistan (10.1%, a difference of 0.14%), and Immigrants from Northern Europe (10.1%, a difference of 0.21%).
| Demographics | Rating | Rank | Disability Age 35 to 64 |
| Immigrants | Czechoslovakia | 99.7 /100 | #63 | Exceptional 10.0% |
| Immigrants | Romania | 99.7 /100 | #64 | Exceptional 10.0% |
| Immigrants | Poland | 99.6 /100 | #65 | Exceptional 10.0% |
| Cubans | 99.6 /100 | #66 | Exceptional 10.0% |
| Immigrants | Uzbekistan | 99.5 /100 | #67 | Exceptional 10.1% |
| Immigrants | Switzerland | 99.5 /100 | #68 | Exceptional 10.1% |
| Immigrants | Eastern Europe | 99.5 /100 | #69 | Exceptional 10.1% |
| Immigrants | Nicaragua | 99.5 /100 | #70 | Exceptional 10.1% |
| Immigrants | Kazakhstan | 99.5 /100 | #71 | Exceptional 10.1% |
| Immigrants | Northern Europe | 99.5 /100 | #72 | Exceptional 10.1% |
| Immigrants | France | 99.5 /100 | #73 | Exceptional 10.1% |
| Laotians | 99.4 /100 | #74 | Exceptional 10.1% |
| Immigrants | Latvia | 99.4 /100 | #75 | Exceptional 10.1% |
| Immigrants | Chile | 99.4 /100 | #76 | Exceptional 10.1% |
| Mongolians | 99.4 /100 | #77 | Exceptional 10.1% |
Demographics Similar to French Canadians by Disability Age 35 to 64
In terms of disability age 35 to 64, the demographic groups most similar to French Canadians are Immigrants from Micronesia (12.9%, a difference of 0.020%), Immigrants from Dominican Republic (12.9%, a difference of 0.030%), Liberian (12.9%, a difference of 0.19%), Somali (12.9%, a difference of 0.23%), and Dominican (12.9%, a difference of 0.34%).
| Demographics | Rating | Rank | Disability Age 35 to 64 |
| Nepalese | 0.1 /100 | #271 | Tragic 12.8% |
| U.S. Virgin Islanders | 0.1 /100 | #272 | Tragic 12.8% |
| Pennsylvania Germans | 0.1 /100 | #273 | Tragic 12.8% |
| Celtics | 0.1 /100 | #274 | Tragic 12.9% |
| Dominicans | 0.1 /100 | #275 | Tragic 12.9% |
| Somalis | 0.1 /100 | #276 | Tragic 12.9% |
| Immigrants | Dominican Republic | 0.1 /100 | #277 | Tragic 12.9% |
| French Canadians | 0.1 /100 | #278 | Tragic 12.9% |
| Immigrants | Micronesia | 0.1 /100 | #279 | Tragic 12.9% |
| Liberians | 0.1 /100 | #280 | Tragic 12.9% |
| Scotch-Irish | 0.1 /100 | #281 | Tragic 13.0% |
| Immigrants | Laos | 0.1 /100 | #282 | Tragic 13.0% |
| Central American Indians | 0.0 /100 | #283 | Tragic 13.0% |
| Immigrants | Nonimmigrants | 0.0 /100 | #284 | Tragic 13.0% |
| Immigrants | Somalia | 0.0 /100 | #285 | Tragic 13.1% |