Immigrants from Nicaragua vs Immigrants from Lebanon Disability Age 65 to 74
COMPARE
Immigrants from Nicaragua
Immigrants from Lebanon
Disability Age 65 to 74
Disability Age 65 to 74 Comparison
Immigrants from Nicaragua
Immigrants from Lebanon
24.1%
DISABILITY AGE 65 TO 74
9.8/ 100
METRIC RATING
221st/ 347
METRIC RANK
21.9%
DISABILITY AGE 65 TO 74
98.4/ 100
METRIC RATING
85th/ 347
METRIC RANK
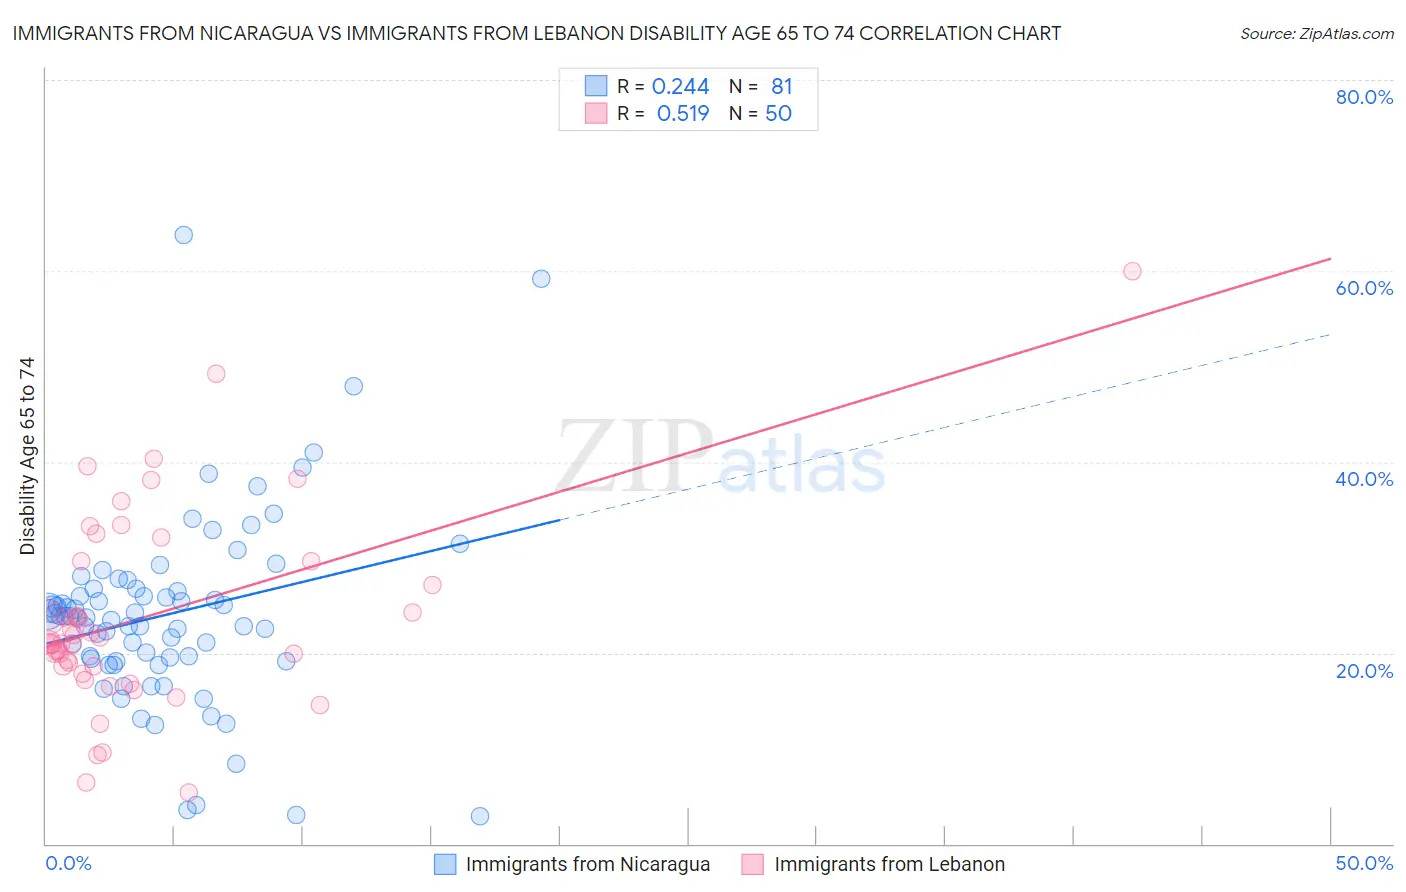
Immigrants from Nicaragua vs Immigrants from Lebanon Disability Age 65 to 74 Correlation Chart
The statistical analysis conducted on geographies consisting of 236,202,559 people shows a weak positive correlation between the proportion of Immigrants from Nicaragua and percentage of population with a disability between the ages 65 and 75 in the United States with a correlation coefficient (R) of 0.244 and weighted average of 24.1%. Similarly, the statistical analysis conducted on geographies consisting of 217,046,866 people shows a substantial positive correlation between the proportion of Immigrants from Lebanon and percentage of population with a disability between the ages 65 and 75 in the United States with a correlation coefficient (R) of 0.519 and weighted average of 21.9%, a difference of 9.9%.
Disability Age 65 to 74 Correlation Summary
| Measurement | Immigrants from Nicaragua | Immigrants from Lebanon |
| Minimum | 2.9% | 5.3% |
| Maximum | 63.7% | 60.0% |
| Range | 60.9% | 54.7% |
| Mean | 24.0% | 23.7% |
| Median | 23.8% | 21.0% |
| Interquartile 25% (IQ1) | 19.3% | 18.6% |
| Interquartile 75% (IQ3) | 26.7% | 29.6% |
| Interquartile Range (IQR) | 7.5% | 11.1% |
| Standard Deviation (Sample) | 10.0% | 10.4% |
| Standard Deviation (Population) | 10.0% | 10.2% |
Similar Demographics by Disability Age 65 to 74
Demographics Similar to Immigrants from Nicaragua by Disability Age 65 to 74
In terms of disability age 65 to 74, the demographic groups most similar to Immigrants from Nicaragua are Native Hawaiian (24.1%, a difference of 0.070%), Ghanaian (24.1%, a difference of 0.090%), Immigrants from Middle Africa (24.1%, a difference of 0.14%), Immigrants from Panama (24.1%, a difference of 0.19%), and Immigrants from Burma/Myanmar (24.0%, a difference of 0.27%).
| Demographics | Rating | Rank | Disability Age 65 to 74 |
| Immigrants | Oceania | 13.6 /100 | #214 | Poor 24.0% |
| Pennsylvania Germans | 13.3 /100 | #215 | Poor 24.0% |
| Jamaicans | 12.2 /100 | #216 | Poor 24.0% |
| Immigrants | Portugal | 11.7 /100 | #217 | Poor 24.0% |
| Immigrants | Nigeria | 11.7 /100 | #218 | Poor 24.0% |
| Immigrants | Burma/Myanmar | 11.6 /100 | #219 | Poor 24.0% |
| Ghanaians | 10.4 /100 | #220 | Poor 24.1% |
| Immigrants | Nicaragua | 9.8 /100 | #221 | Tragic 24.1% |
| Native Hawaiians | 9.3 /100 | #222 | Tragic 24.1% |
| Immigrants | Middle Africa | 8.9 /100 | #223 | Tragic 24.1% |
| Immigrants | Panama | 8.6 /100 | #224 | Tragic 24.1% |
| Bermudans | 8.2 /100 | #225 | Tragic 24.2% |
| Iraqis | 8.1 /100 | #226 | Tragic 24.2% |
| Nigerians | 7.8 /100 | #227 | Tragic 24.2% |
| Whites/Caucasians | 6.6 /100 | #228 | Tragic 24.2% |
Demographics Similar to Immigrants from Lebanon by Disability Age 65 to 74
In terms of disability age 65 to 74, the demographic groups most similar to Immigrants from Lebanon are South African (21.9%, a difference of 0.080%), Immigrants from Spain (21.9%, a difference of 0.10%), Immigrants from Brazil (21.9%, a difference of 0.12%), Immigrants from Indonesia (21.9%, a difference of 0.29%), and Australian (22.0%, a difference of 0.42%).
| Demographics | Rating | Rank | Disability Age 65 to 74 |
| Immigrants | Eastern Europe | 99.0 /100 | #78 | Exceptional 21.8% |
| Venezuelans | 99.0 /100 | #79 | Exceptional 21.8% |
| Immigrants | Norway | 98.9 /100 | #80 | Exceptional 21.8% |
| Croatians | 98.9 /100 | #81 | Exceptional 21.8% |
| Immigrants | Indonesia | 98.7 /100 | #82 | Exceptional 21.9% |
| Immigrants | Brazil | 98.5 /100 | #83 | Exceptional 21.9% |
| Immigrants | Spain | 98.5 /100 | #84 | Exceptional 21.9% |
| Immigrants | Lebanon | 98.4 /100 | #85 | Exceptional 21.9% |
| South Africans | 98.4 /100 | #86 | Exceptional 21.9% |
| Australians | 98.0 /100 | #87 | Exceptional 22.0% |
| Immigrants | Netherlands | 97.9 /100 | #88 | Exceptional 22.0% |
| Immigrants | Kuwait | 97.9 /100 | #89 | Exceptional 22.0% |
| Italians | 97.9 /100 | #90 | Exceptional 22.0% |
| Chileans | 97.9 /100 | #91 | Exceptional 22.0% |
| Poles | 97.8 /100 | #92 | Exceptional 22.0% |