Immigrants from Spain vs French Canadian Disability Age 35 to 64
COMPARE
Immigrants from Spain
French Canadian
Disability Age 35 to 64
Disability Age 35 to 64 Comparison
Immigrants from Spain
French Canadians
10.0%
DISABILITY AGE 35 TO 64
99.7/ 100
METRIC RATING
61st/ 347
METRIC RANK
12.9%
DISABILITY AGE 35 TO 64
0.1/ 100
METRIC RATING
278th/ 347
METRIC RANK
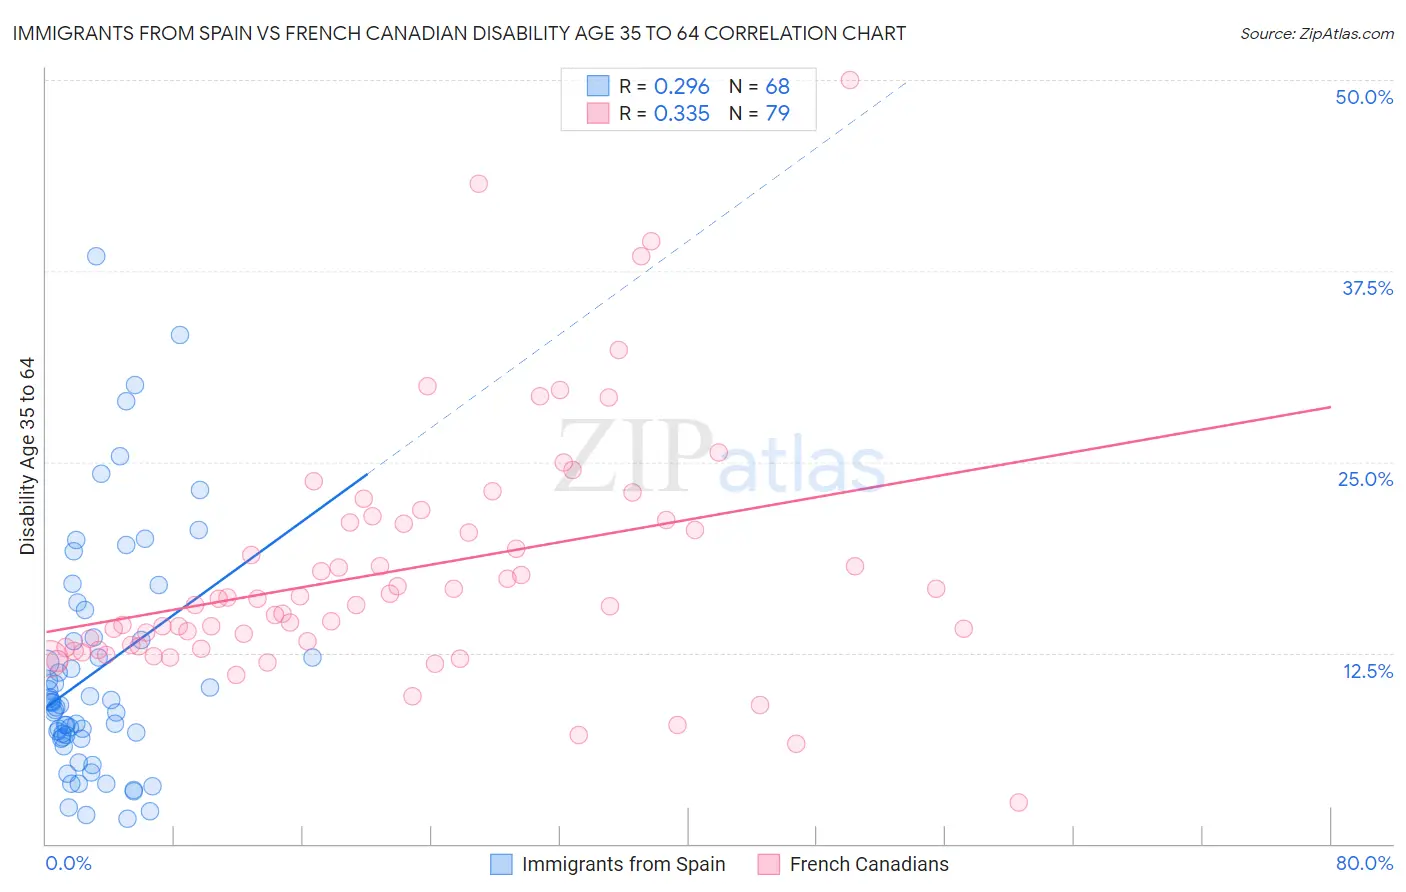
Immigrants from Spain vs French Canadian Disability Age 35 to 64 Correlation Chart
The statistical analysis conducted on geographies consisting of 239,593,165 people shows a weak positive correlation between the proportion of Immigrants from Spain and percentage of population with a disability between the ages 34 and 64 in the United States with a correlation coefficient (R) of 0.296 and weighted average of 10.0%. Similarly, the statistical analysis conducted on geographies consisting of 502,069,679 people shows a mild positive correlation between the proportion of French Canadians and percentage of population with a disability between the ages 34 and 64 in the United States with a correlation coefficient (R) of 0.335 and weighted average of 12.9%, a difference of 29.8%.
Disability Age 35 to 64 Correlation Summary
| Measurement | Immigrants from Spain | French Canadian |
| Minimum | 1.7% | 2.7% |
| Maximum | 38.5% | 50.0% |
| Range | 36.8% | 47.3% |
| Mean | 11.3% | 17.9% |
| Median | 9.2% | 15.6% |
| Interquartile 25% (IQ1) | 6.9% | 12.8% |
| Interquartile 75% (IQ3) | 13.4% | 21.0% |
| Interquartile Range (IQR) | 6.5% | 8.2% |
| Standard Deviation (Sample) | 7.7% | 8.1% |
| Standard Deviation (Population) | 7.7% | 8.1% |
Similar Demographics by Disability Age 35 to 64
Demographics Similar to Immigrants from Spain by Disability Age 35 to 64
In terms of disability age 35 to 64, the demographic groups most similar to Immigrants from Spain are Eastern European (10.0%, a difference of 0.10%), Immigrants from South America (9.9%, a difference of 0.12%), Immigrants from Czechoslovakia (10.0%, a difference of 0.22%), Immigrants from Sweden (9.9%, a difference of 0.33%), and Immigrants from Romania (10.0%, a difference of 0.41%).
| Demographics | Rating | Rank | Disability Age 35 to 64 |
| Immigrants | Russia | 99.8 /100 | #54 | Exceptional 9.8% |
| Peruvians | 99.8 /100 | #55 | Exceptional 9.9% |
| South Americans | 99.8 /100 | #56 | Exceptional 9.9% |
| Colombians | 99.8 /100 | #57 | Exceptional 9.9% |
| Armenians | 99.8 /100 | #58 | Exceptional 9.9% |
| Immigrants | Sweden | 99.7 /100 | #59 | Exceptional 9.9% |
| Immigrants | South America | 99.7 /100 | #60 | Exceptional 9.9% |
| Immigrants | Spain | 99.7 /100 | #61 | Exceptional 10.0% |
| Eastern Europeans | 99.7 /100 | #62 | Exceptional 10.0% |
| Immigrants | Czechoslovakia | 99.7 /100 | #63 | Exceptional 10.0% |
| Immigrants | Romania | 99.7 /100 | #64 | Exceptional 10.0% |
| Immigrants | Poland | 99.6 /100 | #65 | Exceptional 10.0% |
| Cubans | 99.6 /100 | #66 | Exceptional 10.0% |
| Immigrants | Uzbekistan | 99.5 /100 | #67 | Exceptional 10.1% |
| Immigrants | Switzerland | 99.5 /100 | #68 | Exceptional 10.1% |
Demographics Similar to French Canadians by Disability Age 35 to 64
In terms of disability age 35 to 64, the demographic groups most similar to French Canadians are Immigrants from Micronesia (12.9%, a difference of 0.020%), Immigrants from Dominican Republic (12.9%, a difference of 0.030%), Liberian (12.9%, a difference of 0.19%), Somali (12.9%, a difference of 0.23%), and Dominican (12.9%, a difference of 0.34%).
| Demographics | Rating | Rank | Disability Age 35 to 64 |
| Nepalese | 0.1 /100 | #271 | Tragic 12.8% |
| U.S. Virgin Islanders | 0.1 /100 | #272 | Tragic 12.8% |
| Pennsylvania Germans | 0.1 /100 | #273 | Tragic 12.8% |
| Celtics | 0.1 /100 | #274 | Tragic 12.9% |
| Dominicans | 0.1 /100 | #275 | Tragic 12.9% |
| Somalis | 0.1 /100 | #276 | Tragic 12.9% |
| Immigrants | Dominican Republic | 0.1 /100 | #277 | Tragic 12.9% |
| French Canadians | 0.1 /100 | #278 | Tragic 12.9% |
| Immigrants | Micronesia | 0.1 /100 | #279 | Tragic 12.9% |
| Liberians | 0.1 /100 | #280 | Tragic 12.9% |
| Scotch-Irish | 0.1 /100 | #281 | Tragic 13.0% |
| Immigrants | Laos | 0.1 /100 | #282 | Tragic 13.0% |
| Central American Indians | 0.0 /100 | #283 | Tragic 13.0% |
| Immigrants | Nonimmigrants | 0.0 /100 | #284 | Tragic 13.0% |
| Immigrants | Somalia | 0.0 /100 | #285 | Tragic 13.1% |