Immigrants from Netherlands vs Mongolian Vision Disability
COMPARE
Immigrants from Netherlands
Mongolian
Vision Disability
Vision Disability Comparison
Immigrants from Netherlands
Mongolians
2.1%
VISION DISABILITY
84.2/ 100
METRIC RATING
140th/ 347
METRIC RANK
1.9%
VISION DISABILITY
99.9/ 100
METRIC RATING
31st/ 347
METRIC RANK
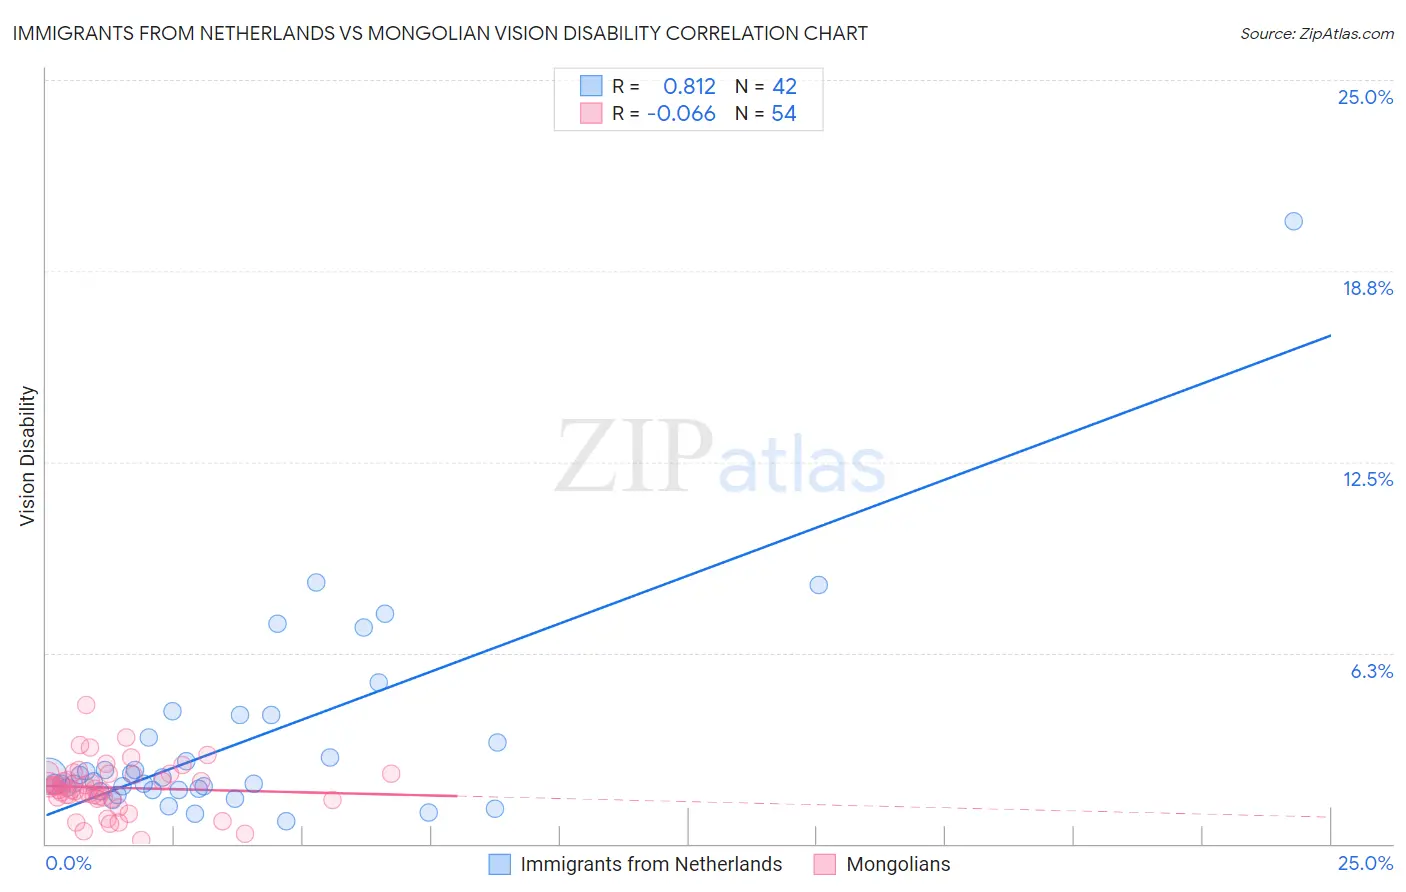
Immigrants from Netherlands vs Mongolian Vision Disability Correlation Chart
The statistical analysis conducted on geographies consisting of 237,808,259 people shows a very strong positive correlation between the proportion of Immigrants from Netherlands and percentage of population with vision disability in the United States with a correlation coefficient (R) of 0.812 and weighted average of 2.1%. Similarly, the statistical analysis conducted on geographies consisting of 140,326,151 people shows a slight negative correlation between the proportion of Mongolians and percentage of population with vision disability in the United States with a correlation coefficient (R) of -0.066 and weighted average of 1.9%, a difference of 9.1%.
Vision Disability Correlation Summary
| Measurement | Immigrants from Netherlands | Mongolian |
| Minimum | 0.76% | 0.13% |
| Maximum | 20.4% | 4.5% |
| Range | 19.6% | 4.4% |
| Mean | 3.3% | 1.8% |
| Median | 2.1% | 1.8% |
| Interquartile 25% (IQ1) | 1.8% | 1.5% |
| Interquartile 75% (IQ3) | 3.5% | 2.3% |
| Interquartile Range (IQR) | 1.7% | 0.76% |
| Standard Deviation (Sample) | 3.4% | 0.81% |
| Standard Deviation (Population) | 3.3% | 0.80% |
Similar Demographics by Vision Disability
Demographics Similar to Immigrants from Netherlands by Vision Disability
In terms of vision disability, the demographic groups most similar to Immigrants from Netherlands are Sierra Leonean (2.1%, a difference of 0.010%), Immigrants from Morocco (2.1%, a difference of 0.13%), South American (2.1%, a difference of 0.16%), Immigrants from Sierra Leone (2.1%, a difference of 0.16%), and Ukrainian (2.1%, a difference of 0.26%).
| Demographics | Rating | Rank | Vision Disability |
| Syrians | 87.5 /100 | #133 | Excellent 2.1% |
| Venezuelans | 87.2 /100 | #134 | Excellent 2.1% |
| Vietnamese | 86.7 /100 | #135 | Excellent 2.1% |
| Czechs | 86.3 /100 | #136 | Excellent 2.1% |
| Immigrants | South Eastern Asia | 86.3 /100 | #137 | Excellent 2.1% |
| Arabs | 86.3 /100 | #138 | Excellent 2.1% |
| Immigrants | Morocco | 85.2 /100 | #139 | Excellent 2.1% |
| Immigrants | Netherlands | 84.2 /100 | #140 | Excellent 2.1% |
| Sierra Leoneans | 84.1 /100 | #141 | Excellent 2.1% |
| South Americans | 82.8 /100 | #142 | Excellent 2.1% |
| Immigrants | Sierra Leone | 82.8 /100 | #143 | Excellent 2.1% |
| Ukrainians | 81.9 /100 | #144 | Excellent 2.1% |
| Immigrants | Bosnia and Herzegovina | 81.5 /100 | #145 | Excellent 2.1% |
| Italians | 79.7 /100 | #146 | Good 2.1% |
| Immigrants | Sudan | 78.4 /100 | #147 | Good 2.1% |
Demographics Similar to Mongolians by Vision Disability
In terms of vision disability, the demographic groups most similar to Mongolians are Immigrants from Nepal (1.9%, a difference of 0.17%), Egyptian (1.9%, a difference of 0.20%), Immigrants from Malaysia (1.9%, a difference of 0.27%), Luxembourger (1.9%, a difference of 0.27%), and Taiwanese (1.9%, a difference of 0.29%).
| Demographics | Rating | Rank | Vision Disability |
| Immigrants | Lithuania | 99.9 /100 | #24 | Exceptional 1.9% |
| Bulgarians | 99.9 /100 | #25 | Exceptional 1.9% |
| Immigrants | Japan | 99.9 /100 | #26 | Exceptional 1.9% |
| Taiwanese | 99.9 /100 | #27 | Exceptional 1.9% |
| Immigrants | Malaysia | 99.9 /100 | #28 | Exceptional 1.9% |
| Egyptians | 99.9 /100 | #29 | Exceptional 1.9% |
| Immigrants | Nepal | 99.9 /100 | #30 | Exceptional 1.9% |
| Mongolians | 99.9 /100 | #31 | Exceptional 1.9% |
| Luxembourgers | 99.9 /100 | #32 | Exceptional 1.9% |
| Immigrants | Egypt | 99.9 /100 | #33 | Exceptional 1.9% |
| Immigrants | Turkey | 99.8 /100 | #34 | Exceptional 1.9% |
| Immigrants | Australia | 99.8 /100 | #35 | Exceptional 1.9% |
| Cambodians | 99.8 /100 | #36 | Exceptional 2.0% |
| Bhutanese | 99.8 /100 | #37 | Exceptional 2.0% |
| Immigrants | Kuwait | 99.8 /100 | #38 | Exceptional 2.0% |