Immigrants from Moldova vs Immigrants from Ghana Disability Age Under 5
COMPARE
Immigrants from Moldova
Immigrants from Ghana
Disability Age Under 5
Disability Age Under 5 Comparison
Immigrants from Moldova
Immigrants from Ghana
1.1%
DISABILITY AGE UNDER 5
96.8/ 100
METRIC RATING
95th/ 347
METRIC RANK
1.2%
DISABILITY AGE UNDER 5
68.7/ 100
METRIC RATING
155th/ 347
METRIC RANK
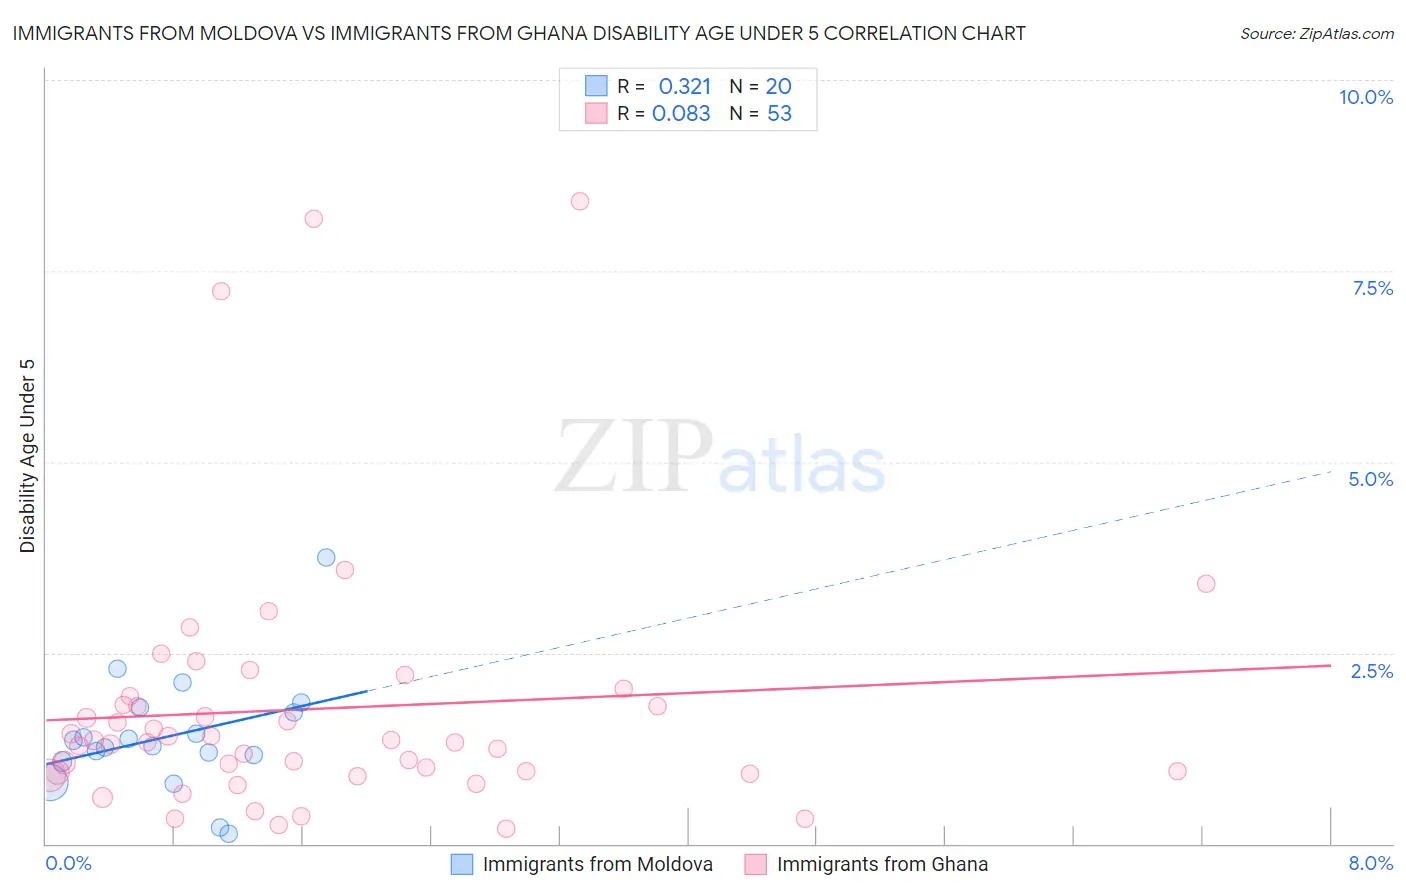
Immigrants from Moldova vs Immigrants from Ghana Disability Age Under 5 Correlation Chart
The statistical analysis conducted on geographies consisting of 88,816,891 people shows a mild positive correlation between the proportion of Immigrants from Moldova and percentage of population with a disability under the age of 5 in the United States with a correlation coefficient (R) of 0.321 and weighted average of 1.1%. Similarly, the statistical analysis conducted on geographies consisting of 133,499,136 people shows a slight positive correlation between the proportion of Immigrants from Ghana and percentage of population with a disability under the age of 5 in the United States with a correlation coefficient (R) of 0.083 and weighted average of 1.2%, a difference of 6.4%.
Disability Age Under 5 Correlation Summary
| Measurement | Immigrants from Moldova | Immigrants from Ghana |
| Minimum | 0.14% | 0.20% |
| Maximum | 3.7% | 8.4% |
| Range | 3.6% | 8.2% |
| Mean | 1.4% | 1.8% |
| Median | 1.3% | 1.3% |
| Interquartile 25% (IQ1) | 1.1% | 0.92% |
| Interquartile 75% (IQ3) | 1.8% | 1.9% |
| Interquartile Range (IQR) | 0.63% | 0.96% |
| Standard Deviation (Sample) | 0.77% | 1.7% |
| Standard Deviation (Population) | 0.75% | 1.7% |
Similar Demographics by Disability Age Under 5
Demographics Similar to Immigrants from Moldova by Disability Age Under 5
In terms of disability age under 5, the demographic groups most similar to Immigrants from Moldova are Sri Lankan (1.1%, a difference of 0.050%), Mongolian (1.1%, a difference of 0.10%), Spanish American (1.1%, a difference of 0.11%), Immigrants from Cuba (1.1%, a difference of 0.14%), and Immigrants from Iraq (1.1%, a difference of 0.20%).
| Demographics | Rating | Rank | Disability Age Under 5 |
| Immigrants | Dominican Republic | 97.5 /100 | #88 | Exceptional 1.1% |
| Ethiopians | 97.2 /100 | #89 | Exceptional 1.1% |
| Chinese | 97.2 /100 | #90 | Exceptional 1.1% |
| Albanians | 97.2 /100 | #91 | Exceptional 1.1% |
| Immigrants | Cuba | 97.0 /100 | #92 | Exceptional 1.1% |
| Spanish Americans | 96.9 /100 | #93 | Exceptional 1.1% |
| Sri Lankans | 96.8 /100 | #94 | Exceptional 1.1% |
| Immigrants | Moldova | 96.8 /100 | #95 | Exceptional 1.1% |
| Mongolians | 96.6 /100 | #96 | Exceptional 1.1% |
| Immigrants | Iraq | 96.5 /100 | #97 | Exceptional 1.1% |
| Immigrants | South Eastern Asia | 96.5 /100 | #98 | Exceptional 1.1% |
| Dominicans | 96.3 /100 | #99 | Exceptional 1.1% |
| Nicaraguans | 96.3 /100 | #100 | Exceptional 1.1% |
| Immigrants | Uganda | 96.1 /100 | #101 | Exceptional 1.1% |
| Immigrants | Morocco | 96.0 /100 | #102 | Exceptional 1.2% |
Demographics Similar to Immigrants from Ghana by Disability Age Under 5
In terms of disability age under 5, the demographic groups most similar to Immigrants from Ghana are Uruguayan (1.2%, a difference of 0.010%), Hawaiian (1.2%, a difference of 0.020%), Immigrants from Thailand (1.2%, a difference of 0.080%), Immigrants from South America (1.2%, a difference of 0.18%), and Arab (1.2%, a difference of 0.24%).
| Demographics | Rating | Rank | Disability Age Under 5 |
| Ghanaians | 76.3 /100 | #148 | Good 1.2% |
| Kenyans | 75.9 /100 | #149 | Good 1.2% |
| South Americans | 75.6 /100 | #150 | Good 1.2% |
| Yaqui | 74.8 /100 | #151 | Good 1.2% |
| Hondurans | 72.5 /100 | #152 | Good 1.2% |
| Immigrants | Thailand | 69.4 /100 | #153 | Good 1.2% |
| Uruguayans | 68.8 /100 | #154 | Good 1.2% |
| Immigrants | Ghana | 68.7 /100 | #155 | Good 1.2% |
| Hawaiians | 68.5 /100 | #156 | Good 1.2% |
| Immigrants | South America | 67.0 /100 | #157 | Good 1.2% |
| Arabs | 66.4 /100 | #158 | Good 1.2% |
| Colombians | 65.8 /100 | #159 | Good 1.2% |
| Immigrants | Latin America | 65.8 /100 | #160 | Good 1.2% |
| Immigrants | Africa | 65.1 /100 | #161 | Good 1.2% |
| Guatemalans | 63.6 /100 | #162 | Good 1.2% |