Immigrants from Micronesia vs Filipino Disability Age 35 to 64
COMPARE
Immigrants from Micronesia
Filipino
Disability Age 35 to 64
Disability Age 35 to 64 Comparison
Immigrants from Micronesia
Filipinos
12.9%
DISABILITY AGE 35 TO 64
0.1/ 100
METRIC RATING
279th/ 347
METRIC RANK
8.0%
DISABILITY AGE 35 TO 64
100.0/ 100
METRIC RATING
2nd/ 347
METRIC RANK
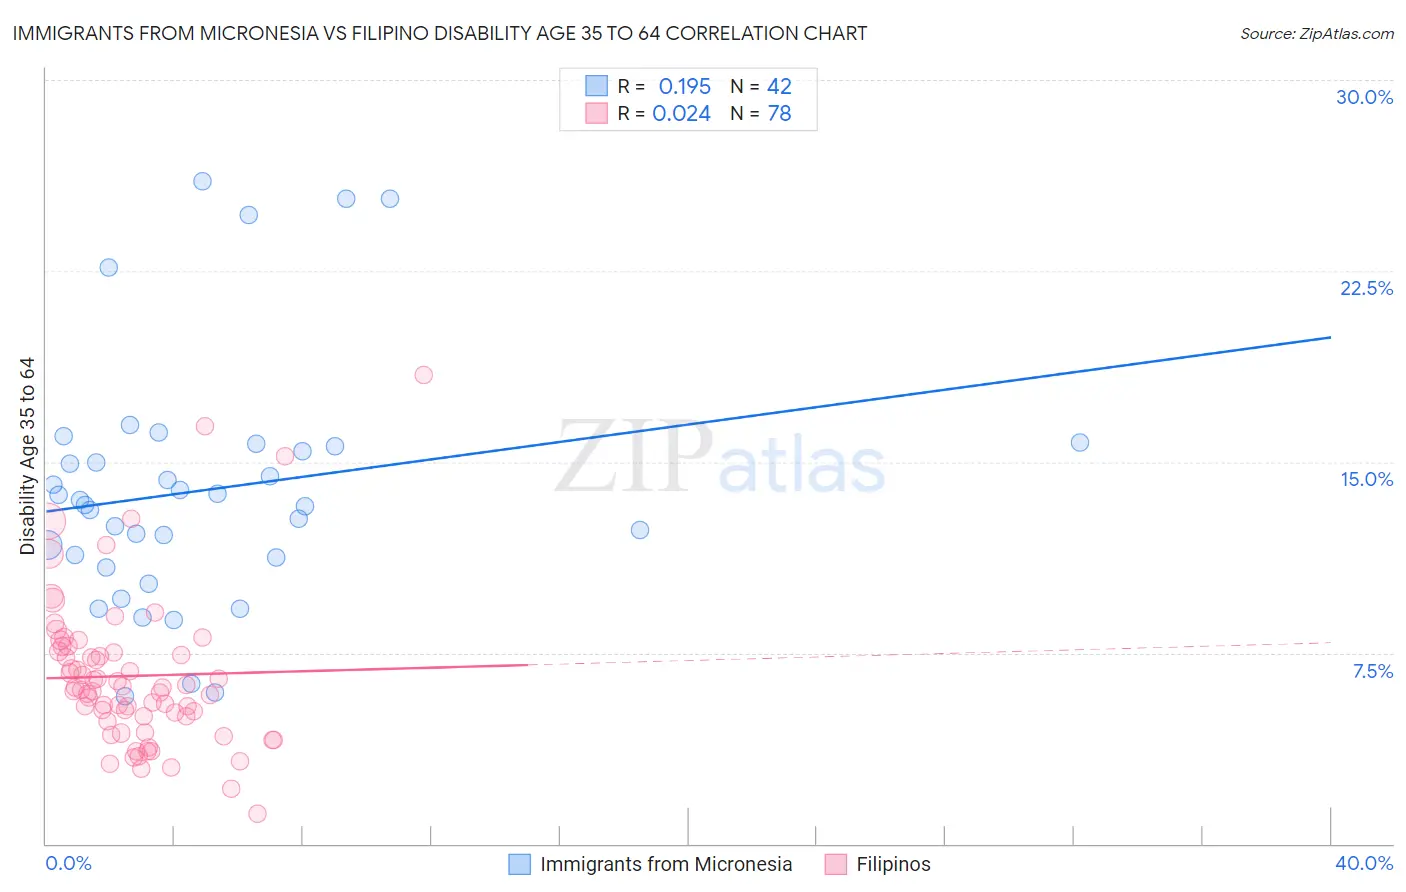
Immigrants from Micronesia vs Filipino Disability Age 35 to 64 Correlation Chart
The statistical analysis conducted on geographies consisting of 61,599,230 people shows a poor positive correlation between the proportion of Immigrants from Micronesia and percentage of population with a disability between the ages 34 and 64 in the United States with a correlation coefficient (R) of 0.195 and weighted average of 12.9%. Similarly, the statistical analysis conducted on geographies consisting of 254,159,243 people shows no correlation between the proportion of Filipinos and percentage of population with a disability between the ages 34 and 64 in the United States with a correlation coefficient (R) of 0.024 and weighted average of 8.0%, a difference of 60.5%.
Disability Age 35 to 64 Correlation Summary
| Measurement | Immigrants from Micronesia | Filipino |
| Minimum | 5.8% | 1.2% |
| Maximum | 26.0% | 18.4% |
| Range | 20.3% | 17.2% |
| Mean | 13.9% | 6.6% |
| Median | 13.4% | 6.1% |
| Interquartile 25% (IQ1) | 11.3% | 5.0% |
| Interquartile 75% (IQ3) | 15.6% | 7.6% |
| Interquartile Range (IQR) | 4.4% | 2.6% |
| Standard Deviation (Sample) | 4.9% | 3.0% |
| Standard Deviation (Population) | 4.8% | 3.0% |
Similar Demographics by Disability Age 35 to 64
Demographics Similar to Immigrants from Micronesia by Disability Age 35 to 64
In terms of disability age 35 to 64, the demographic groups most similar to Immigrants from Micronesia are French Canadian (12.9%, a difference of 0.020%), Immigrants from Dominican Republic (12.9%, a difference of 0.050%), Liberian (12.9%, a difference of 0.17%), Somali (12.9%, a difference of 0.25%), and Scotch-Irish (13.0%, a difference of 0.36%).
| Demographics | Rating | Rank | Disability Age 35 to 64 |
| U.S. Virgin Islanders | 0.1 /100 | #272 | Tragic 12.8% |
| Pennsylvania Germans | 0.1 /100 | #273 | Tragic 12.8% |
| Celtics | 0.1 /100 | #274 | Tragic 12.9% |
| Dominicans | 0.1 /100 | #275 | Tragic 12.9% |
| Somalis | 0.1 /100 | #276 | Tragic 12.9% |
| Immigrants | Dominican Republic | 0.1 /100 | #277 | Tragic 12.9% |
| French Canadians | 0.1 /100 | #278 | Tragic 12.9% |
| Immigrants | Micronesia | 0.1 /100 | #279 | Tragic 12.9% |
| Liberians | 0.1 /100 | #280 | Tragic 12.9% |
| Scotch-Irish | 0.1 /100 | #281 | Tragic 13.0% |
| Immigrants | Laos | 0.1 /100 | #282 | Tragic 13.0% |
| Central American Indians | 0.0 /100 | #283 | Tragic 13.0% |
| Immigrants | Nonimmigrants | 0.0 /100 | #284 | Tragic 13.0% |
| Immigrants | Somalia | 0.0 /100 | #285 | Tragic 13.1% |
| Hmong | 0.0 /100 | #286 | Tragic 13.1% |
Demographics Similar to Filipinos by Disability Age 35 to 64
In terms of disability age 35 to 64, the demographic groups most similar to Filipinos are Immigrants from Hong Kong (8.2%, a difference of 1.8%), Immigrants from Taiwan (7.8%, a difference of 2.5%), Immigrants from India (8.3%, a difference of 2.9%), Immigrants from Iran (8.5%, a difference of 5.5%), and Thai (8.6%, a difference of 6.5%).
| Demographics | Rating | Rank | Disability Age 35 to 64 |
| Immigrants | Taiwan | 100.0 /100 | #1 | Exceptional 7.8% |
| Filipinos | 100.0 /100 | #2 | Exceptional 8.0% |
| Immigrants | Hong Kong | 100.0 /100 | #3 | Exceptional 8.2% |
| Immigrants | India | 100.0 /100 | #4 | Exceptional 8.3% |
| Immigrants | Iran | 100.0 /100 | #5 | Exceptional 8.5% |
| Thais | 100.0 /100 | #6 | Exceptional 8.6% |
| Immigrants | Israel | 100.0 /100 | #7 | Exceptional 8.6% |
| Iranians | 100.0 /100 | #8 | Exceptional 8.7% |
| Immigrants | China | 100.0 /100 | #9 | Exceptional 8.7% |
| Immigrants | Bolivia | 100.0 /100 | #10 | Exceptional 8.7% |
| Immigrants | Eastern Asia | 100.0 /100 | #11 | Exceptional 8.8% |
| Indians (Asian) | 100.0 /100 | #12 | Exceptional 8.9% |
| Immigrants | South Central Asia | 100.0 /100 | #13 | Exceptional 8.9% |
| Immigrants | Singapore | 100.0 /100 | #14 | Exceptional 8.9% |
| Bolivians | 100.0 /100 | #15 | Exceptional 8.9% |