Immigrants from Micronesia vs Immigrants from West Indies Disability Age 35 to 64
COMPARE
Immigrants from Micronesia
Immigrants from West Indies
Disability Age 35 to 64
Disability Age 35 to 64 Comparison
Immigrants from Micronesia
Immigrants from West Indies
12.9%
DISABILITY AGE 35 TO 64
0.1/ 100
METRIC RATING
279th/ 347
METRIC RANK
11.8%
DISABILITY AGE 35 TO 64
8.9/ 100
METRIC RATING
220th/ 347
METRIC RANK
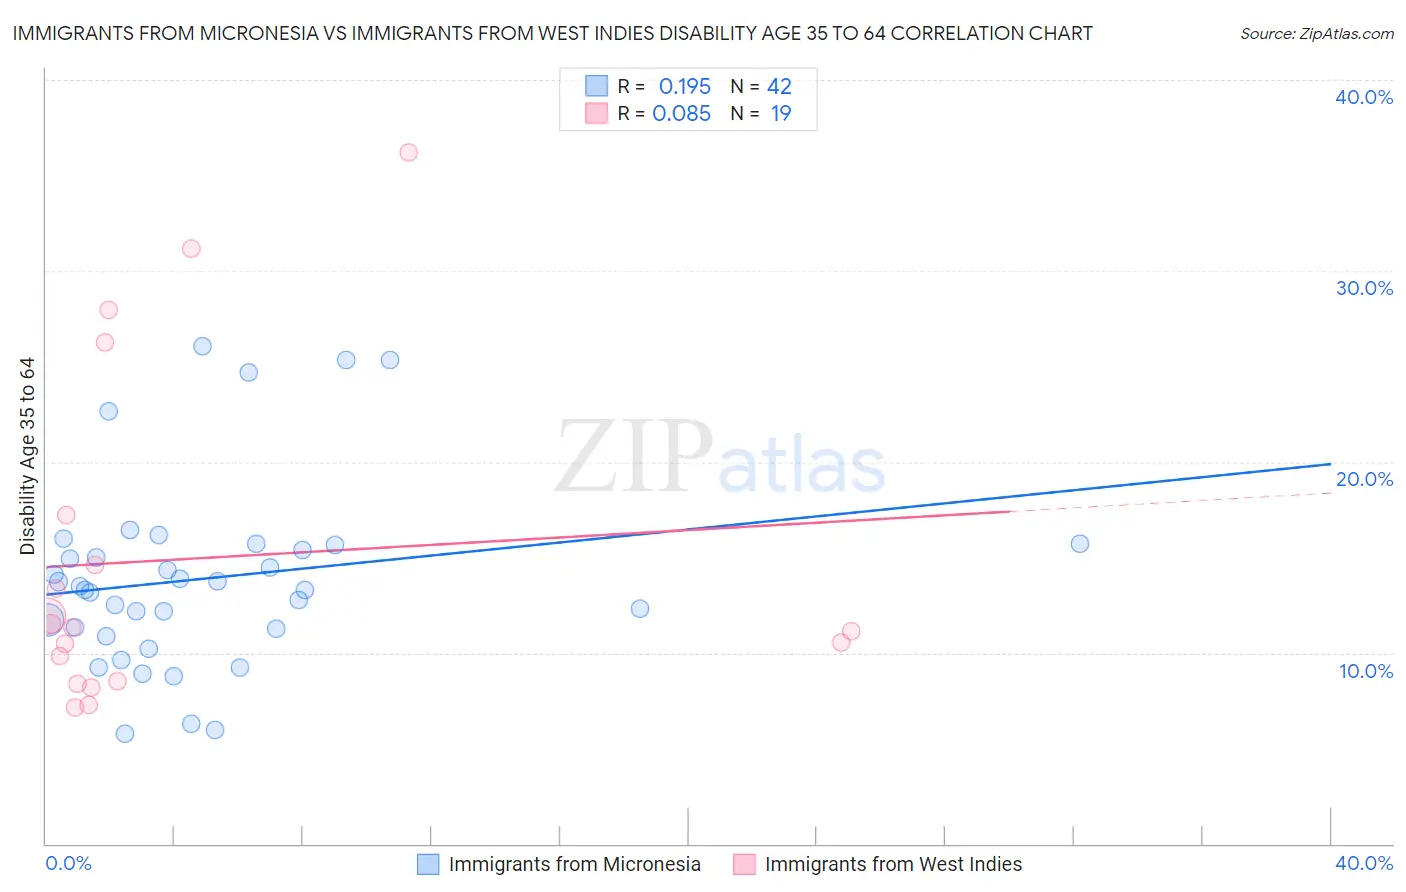
Immigrants from Micronesia vs Immigrants from West Indies Disability Age 35 to 64 Correlation Chart
The statistical analysis conducted on geographies consisting of 61,599,230 people shows a poor positive correlation between the proportion of Immigrants from Micronesia and percentage of population with a disability between the ages 34 and 64 in the United States with a correlation coefficient (R) of 0.195 and weighted average of 12.9%. Similarly, the statistical analysis conducted on geographies consisting of 72,454,628 people shows a slight positive correlation between the proportion of Immigrants from West Indies and percentage of population with a disability between the ages 34 and 64 in the United States with a correlation coefficient (R) of 0.085 and weighted average of 11.8%, a difference of 9.5%.
Disability Age 35 to 64 Correlation Summary
| Measurement | Immigrants from Micronesia | Immigrants from West Indies |
| Minimum | 5.8% | 7.1% |
| Maximum | 26.0% | 36.2% |
| Range | 20.3% | 29.1% |
| Mean | 13.9% | 14.9% |
| Median | 13.4% | 11.4% |
| Interquartile 25% (IQ1) | 11.3% | 8.5% |
| Interquartile 75% (IQ3) | 15.6% | 17.2% |
| Interquartile Range (IQR) | 4.4% | 8.7% |
| Standard Deviation (Sample) | 4.9% | 8.8% |
| Standard Deviation (Population) | 4.8% | 8.5% |
Similar Demographics by Disability Age 35 to 64
Demographics Similar to Immigrants from Micronesia by Disability Age 35 to 64
In terms of disability age 35 to 64, the demographic groups most similar to Immigrants from Micronesia are French Canadian (12.9%, a difference of 0.020%), Immigrants from Dominican Republic (12.9%, a difference of 0.050%), Liberian (12.9%, a difference of 0.17%), Somali (12.9%, a difference of 0.25%), and Scotch-Irish (13.0%, a difference of 0.36%).
| Demographics | Rating | Rank | Disability Age 35 to 64 |
| U.S. Virgin Islanders | 0.1 /100 | #272 | Tragic 12.8% |
| Pennsylvania Germans | 0.1 /100 | #273 | Tragic 12.8% |
| Celtics | 0.1 /100 | #274 | Tragic 12.9% |
| Dominicans | 0.1 /100 | #275 | Tragic 12.9% |
| Somalis | 0.1 /100 | #276 | Tragic 12.9% |
| Immigrants | Dominican Republic | 0.1 /100 | #277 | Tragic 12.9% |
| French Canadians | 0.1 /100 | #278 | Tragic 12.9% |
| Immigrants | Micronesia | 0.1 /100 | #279 | Tragic 12.9% |
| Liberians | 0.1 /100 | #280 | Tragic 12.9% |
| Scotch-Irish | 0.1 /100 | #281 | Tragic 13.0% |
| Immigrants | Laos | 0.1 /100 | #282 | Tragic 13.0% |
| Central American Indians | 0.0 /100 | #283 | Tragic 13.0% |
| Immigrants | Nonimmigrants | 0.0 /100 | #284 | Tragic 13.0% |
| Immigrants | Somalia | 0.0 /100 | #285 | Tragic 13.1% |
| Hmong | 0.0 /100 | #286 | Tragic 13.1% |
Demographics Similar to Immigrants from West Indies by Disability Age 35 to 64
In terms of disability age 35 to 64, the demographic groups most similar to Immigrants from West Indies are Czechoslovakian (11.8%, a difference of 0.050%), Immigrants from Bahamas (11.8%, a difference of 0.090%), Alsatian (11.8%, a difference of 0.090%), Honduran (11.8%, a difference of 0.10%), and Immigrants from Honduras (11.8%, a difference of 0.11%).
| Demographics | Rating | Rank | Disability Age 35 to 64 |
| Yugoslavians | 11.6 /100 | #213 | Poor 11.7% |
| Immigrants | Sudan | 11.4 /100 | #214 | Poor 11.7% |
| Spanish American Indians | 11.1 /100 | #215 | Poor 11.7% |
| Bahamians | 10.7 /100 | #216 | Poor 11.8% |
| Barbadians | 9.5 /100 | #217 | Tragic 11.8% |
| Immigrants | Bahamas | 9.2 /100 | #218 | Tragic 11.8% |
| Czechoslovakians | 9.0 /100 | #219 | Tragic 11.8% |
| Immigrants | West Indies | 8.9 /100 | #220 | Tragic 11.8% |
| Alsatians | 8.5 /100 | #221 | Tragic 11.8% |
| Hondurans | 8.4 /100 | #222 | Tragic 11.8% |
| Immigrants | Honduras | 8.4 /100 | #223 | Tragic 11.8% |
| Immigrants | Ghana | 7.8 /100 | #224 | Tragic 11.8% |
| Immigrants | Belize | 6.6 /100 | #225 | Tragic 11.9% |
| Scandinavians | 6.4 /100 | #226 | Tragic 11.9% |
| Immigrants | Central America | 6.3 /100 | #227 | Tragic 11.9% |