Immigrants from Micronesia vs Northern European Disability Age Over 75
COMPARE
Immigrants from Micronesia
Northern European
Disability Age Over 75
Disability Age Over 75 Comparison
Immigrants from Micronesia
Northern Europeans
50.1%
DISABILITY AGE OVER 75
0.0/ 100
METRIC RATING
299th/ 347
METRIC RANK
46.3%
DISABILITY AGE OVER 75
98.3/ 100
METRIC RATING
90th/ 347
METRIC RANK
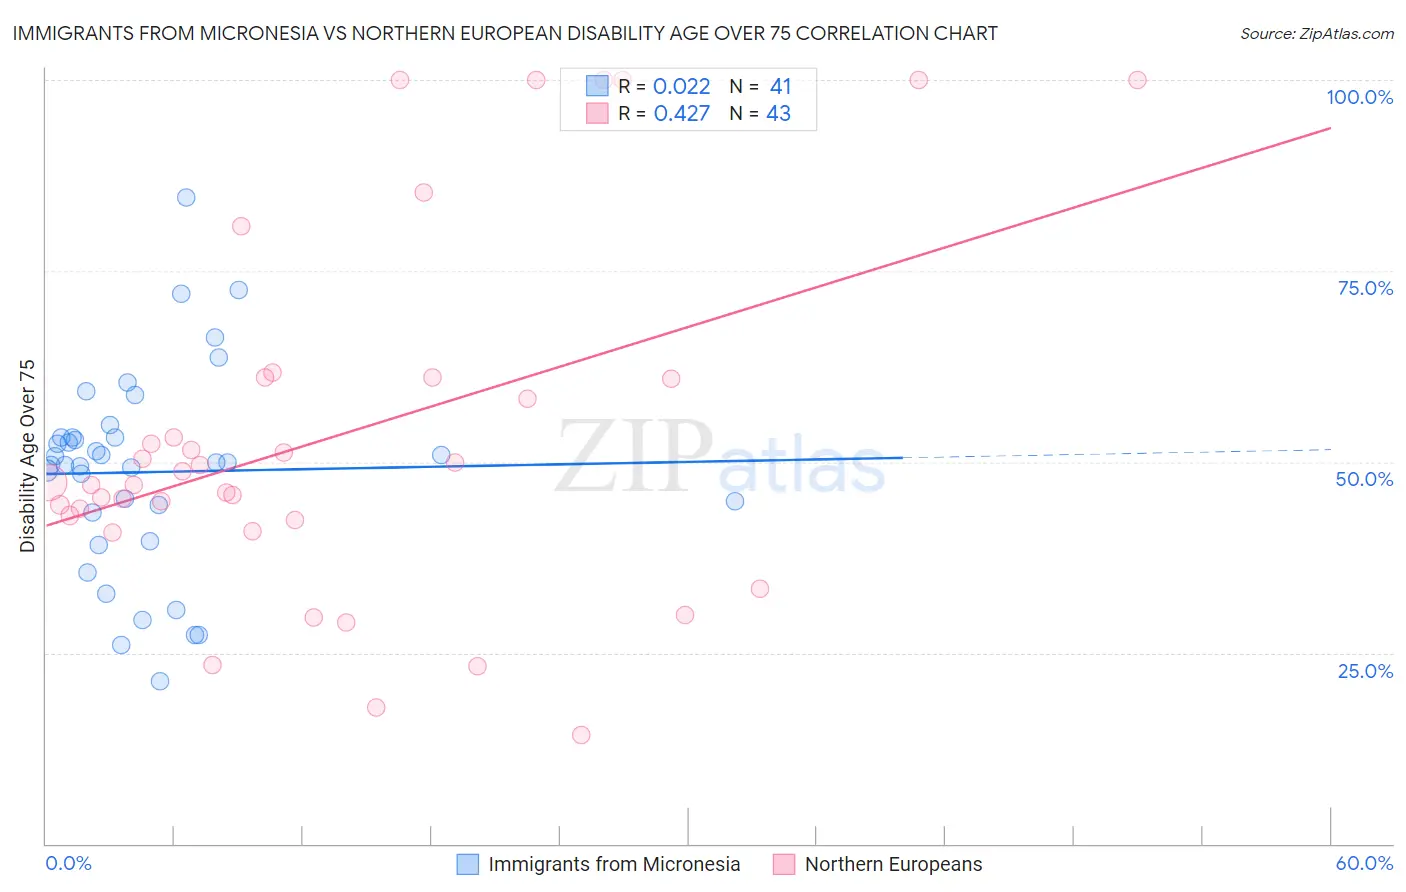
Immigrants from Micronesia vs Northern European Disability Age Over 75 Correlation Chart
The statistical analysis conducted on geographies consisting of 61,409,070 people shows no correlation between the proportion of Immigrants from Micronesia and percentage of population with a disability over the age of 75 in the United States with a correlation coefficient (R) of 0.022 and weighted average of 50.1%. Similarly, the statistical analysis conducted on geographies consisting of 405,622,868 people shows a moderate positive correlation between the proportion of Northern Europeans and percentage of population with a disability over the age of 75 in the United States with a correlation coefficient (R) of 0.427 and weighted average of 46.3%, a difference of 8.3%.
Disability Age Over 75 Correlation Summary
| Measurement | Immigrants from Micronesia | Northern European |
| Minimum | 21.2% | 14.3% |
| Maximum | 84.7% | 100.0% |
| Range | 63.5% | 85.7% |
| Mean | 48.7% | 53.5% |
| Median | 49.9% | 47.4% |
| Interquartile 25% (IQ1) | 41.5% | 42.4% |
| Interquartile 75% (IQ3) | 53.2% | 61.1% |
| Interquartile Range (IQR) | 11.7% | 18.7% |
| Standard Deviation (Sample) | 13.3% | 23.4% |
| Standard Deviation (Population) | 13.1% | 23.1% |
Similar Demographics by Disability Age Over 75
Demographics Similar to Immigrants from Micronesia by Disability Age Over 75
In terms of disability age over 75, the demographic groups most similar to Immigrants from Micronesia are Cape Verdean (50.1%, a difference of 0.040%), Marshallese (50.1%, a difference of 0.070%), Dominican (50.2%, a difference of 0.090%), Armenian (50.0%, a difference of 0.12%), and Mexican American Indian (50.0%, a difference of 0.15%).
| Demographics | Rating | Rank | Disability Age Over 75 |
| Shoshone | 0.0 /100 | #292 | Tragic 49.9% |
| Spanish American Indians | 0.0 /100 | #293 | Tragic 49.9% |
| Immigrants | Cambodia | 0.0 /100 | #294 | Tragic 50.0% |
| Spanish Americans | 0.0 /100 | #295 | Tragic 50.0% |
| Mexican American Indians | 0.0 /100 | #296 | Tragic 50.0% |
| Armenians | 0.0 /100 | #297 | Tragic 50.0% |
| Marshallese | 0.0 /100 | #298 | Tragic 50.1% |
| Immigrants | Micronesia | 0.0 /100 | #299 | Tragic 50.1% |
| Cape Verdeans | 0.0 /100 | #300 | Tragic 50.1% |
| Dominicans | 0.0 /100 | #301 | Tragic 50.2% |
| Cherokee | 0.0 /100 | #302 | Tragic 50.2% |
| Japanese | 0.0 /100 | #303 | Tragic 50.2% |
| Immigrants | Dominican Republic | 0.0 /100 | #304 | Tragic 50.3% |
| Central American Indians | 0.0 /100 | #305 | Tragic 50.5% |
| Immigrants | Central America | 0.0 /100 | #306 | Tragic 50.5% |
Demographics Similar to Northern Europeans by Disability Age Over 75
In terms of disability age over 75, the demographic groups most similar to Northern Europeans are Immigrants from Saudi Arabia (46.3%, a difference of 0.010%), Immigrants from Egypt (46.3%, a difference of 0.010%), Uruguayan (46.2%, a difference of 0.020%), German (46.3%, a difference of 0.050%), and Ugandan (46.3%, a difference of 0.060%).
| Demographics | Rating | Rank | Disability Age Over 75 |
| Argentineans | 98.7 /100 | #83 | Exceptional 46.2% |
| Immigrants | Jordan | 98.7 /100 | #84 | Exceptional 46.2% |
| Immigrants | Southern Europe | 98.6 /100 | #85 | Exceptional 46.2% |
| Romanians | 98.6 /100 | #86 | Exceptional 46.2% |
| Danes | 98.6 /100 | #87 | Exceptional 46.2% |
| Uruguayans | 98.4 /100 | #88 | Exceptional 46.2% |
| Immigrants | Saudi Arabia | 98.4 /100 | #89 | Exceptional 46.3% |
| Northern Europeans | 98.3 /100 | #90 | Exceptional 46.3% |
| Immigrants | Egypt | 98.3 /100 | #91 | Exceptional 46.3% |
| Germans | 98.2 /100 | #92 | Exceptional 46.3% |
| Ugandans | 98.2 /100 | #93 | Exceptional 46.3% |
| Albanians | 98.1 /100 | #94 | Exceptional 46.3% |
| Immigrants | Brazil | 98.0 /100 | #95 | Exceptional 46.3% |
| Immigrants | China | 98.0 /100 | #96 | Exceptional 46.3% |
| Finns | 97.9 /100 | #97 | Exceptional 46.3% |