Immigrants from Lithuania vs Central American Disability Age Under 5
COMPARE
Immigrants from Lithuania
Central American
Disability Age Under 5
Disability Age Under 5 Comparison
Immigrants from Lithuania
Central Americans
1.3%
DISABILITY AGE UNDER 5
27.2/ 100
METRIC RATING
200th/ 347
METRIC RANK
1.2%
DISABILITY AGE UNDER 5
89.7/ 100
METRIC RATING
126th/ 347
METRIC RANK
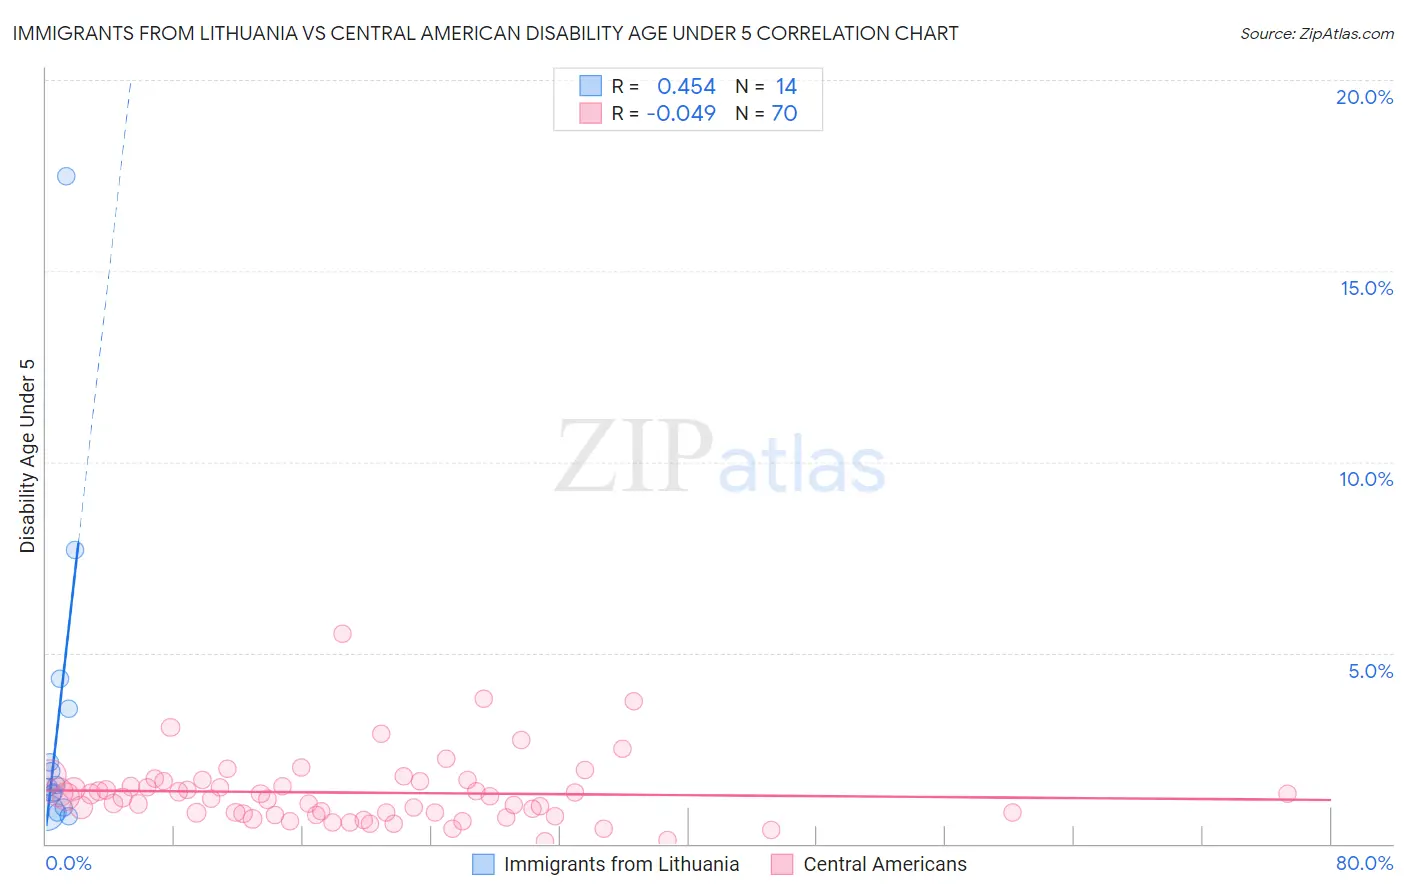
Immigrants from Lithuania vs Central American Disability Age Under 5 Correlation Chart
The statistical analysis conducted on geographies consisting of 85,421,009 people shows a moderate positive correlation between the proportion of Immigrants from Lithuania and percentage of population with a disability under the age of 5 in the United States with a correlation coefficient (R) of 0.454 and weighted average of 1.3%. Similarly, the statistical analysis conducted on geographies consisting of 251,619,686 people shows no correlation between the proportion of Central Americans and percentage of population with a disability under the age of 5 in the United States with a correlation coefficient (R) of -0.049 and weighted average of 1.2%, a difference of 7.5%.
Disability Age Under 5 Correlation Summary
| Measurement | Immigrants from Lithuania | Central American |
| Minimum | 0.71% | 0.078% |
| Maximum | 17.5% | 5.5% |
| Range | 16.8% | 5.4% |
| Mean | 3.3% | 1.3% |
| Median | 1.5% | 1.2% |
| Interquartile 25% (IQ1) | 0.96% | 0.79% |
| Interquartile 75% (IQ3) | 3.5% | 1.6% |
| Interquartile Range (IQR) | 2.6% | 0.84% |
| Standard Deviation (Sample) | 4.5% | 0.90% |
| Standard Deviation (Population) | 4.3% | 0.89% |
Similar Demographics by Disability Age Under 5
Demographics Similar to Immigrants from Lithuania by Disability Age Under 5
In terms of disability age under 5, the demographic groups most similar to Immigrants from Lithuania are Immigrants from Italy (1.3%, a difference of 0.20%), Arapaho (1.3%, a difference of 0.35%), Liberian (1.3%, a difference of 0.37%), Jamaican (1.3%, a difference of 0.38%), and Immigrants from Europe (1.3%, a difference of 0.41%).
| Demographics | Rating | Rank | Disability Age Under 5 |
| Immigrants | Sierra Leone | 36.5 /100 | #193 | Fair 1.3% |
| Immigrants | North Macedonia | 34.7 /100 | #194 | Fair 1.3% |
| U.S. Virgin Islanders | 34.4 /100 | #195 | Fair 1.3% |
| Immigrants | Belgium | 31.4 /100 | #196 | Fair 1.3% |
| Immigrants | Somalia | 31.3 /100 | #197 | Fair 1.3% |
| Immigrants | Norway | 31.1 /100 | #198 | Fair 1.3% |
| Jamaicans | 30.7 /100 | #199 | Fair 1.3% |
| Immigrants | Lithuania | 27.2 /100 | #200 | Fair 1.3% |
| Immigrants | Italy | 25.4 /100 | #201 | Fair 1.3% |
| Arapaho | 24.1 /100 | #202 | Fair 1.3% |
| Liberians | 24.0 /100 | #203 | Fair 1.3% |
| Immigrants | Europe | 23.6 /100 | #204 | Fair 1.3% |
| Romanians | 22.5 /100 | #205 | Fair 1.3% |
| Immigrants | Poland | 22.4 /100 | #206 | Fair 1.3% |
| Nigerians | 21.2 /100 | #207 | Fair 1.3% |
Demographics Similar to Central Americans by Disability Age Under 5
In terms of disability age under 5, the demographic groups most similar to Central Americans are Japanese (1.2%, a difference of 0.16%), Immigrants from Cambodia (1.2%, a difference of 0.22%), Zimbabwean (1.2%, a difference of 0.25%), Aleut (1.2%, a difference of 0.29%), and Immigrants from Romania (1.2%, a difference of 0.30%).
| Demographics | Rating | Rank | Disability Age Under 5 |
| Bhutanese | 92.5 /100 | #119 | Exceptional 1.2% |
| Immigrants | Eritrea | 92.3 /100 | #120 | Exceptional 1.2% |
| Immigrants | Senegal | 91.4 /100 | #121 | Exceptional 1.2% |
| Aleuts | 90.7 /100 | #122 | Exceptional 1.2% |
| Zimbabweans | 90.6 /100 | #123 | Exceptional 1.2% |
| Immigrants | Cambodia | 90.5 /100 | #124 | Exceptional 1.2% |
| Japanese | 90.3 /100 | #125 | Exceptional 1.2% |
| Central Americans | 89.7 /100 | #126 | Excellent 1.2% |
| Immigrants | Romania | 88.4 /100 | #127 | Excellent 1.2% |
| Immigrants | France | 88.4 /100 | #128 | Excellent 1.2% |
| Immigrants | Immigrants | 88.0 /100 | #129 | Excellent 1.2% |
| Koreans | 87.7 /100 | #130 | Excellent 1.2% |
| Immigrants | Serbia | 87.6 /100 | #131 | Excellent 1.2% |
| Immigrants | Eastern Europe | 87.3 /100 | #132 | Excellent 1.2% |
| Immigrants | Spain | 86.5 /100 | #133 | Excellent 1.2% |