Immigrants from Lithuania vs Aleut Cognitive Disability
COMPARE
Immigrants from Lithuania
Aleut
Cognitive Disability
Cognitive Disability Comparison
Immigrants from Lithuania
Aleuts
16.0%
COGNITIVE DISABILITY
100.0/ 100
METRIC RATING
4th/ 347
METRIC RANK
17.0%
COGNITIVE DISABILITY
89.9/ 100
METRIC RATING
141st/ 347
METRIC RANK
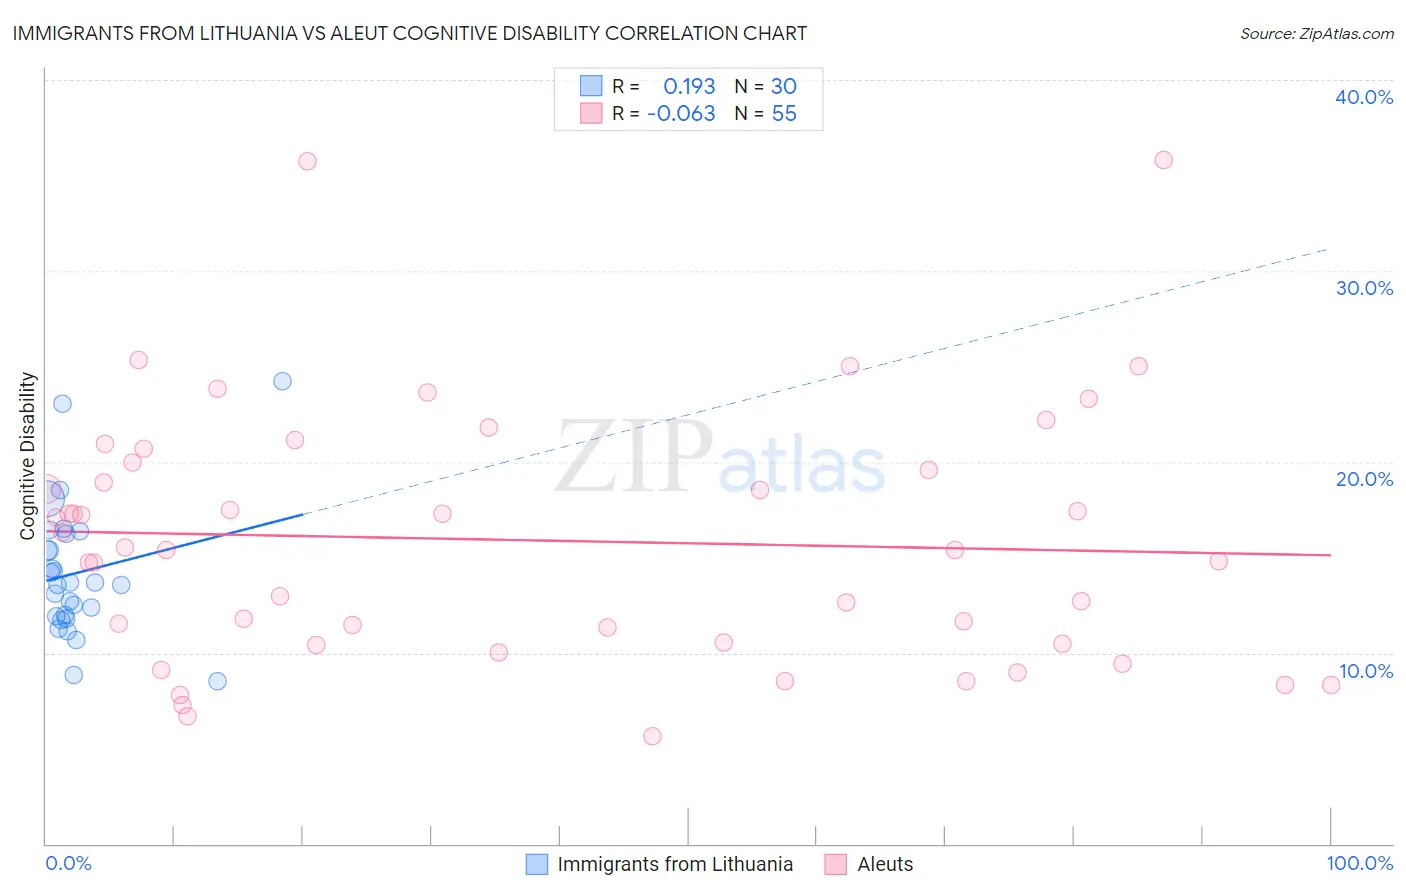
Immigrants from Lithuania vs Aleut Cognitive Disability Correlation Chart
The statistical analysis conducted on geographies consisting of 117,722,792 people shows a poor positive correlation between the proportion of Immigrants from Lithuania and percentage of population with cognitive disability in the United States with a correlation coefficient (R) of 0.193 and weighted average of 16.0%. Similarly, the statistical analysis conducted on geographies consisting of 61,782,027 people shows a slight negative correlation between the proportion of Aleuts and percentage of population with cognitive disability in the United States with a correlation coefficient (R) of -0.063 and weighted average of 17.0%, a difference of 6.6%.
Cognitive Disability Correlation Summary
| Measurement | Immigrants from Lithuania | Aleut |
| Minimum | 8.5% | 5.7% |
| Maximum | 24.2% | 35.8% |
| Range | 15.7% | 30.2% |
| Mean | 14.2% | 15.9% |
| Median | 13.6% | 15.4% |
| Interquartile 25% (IQ1) | 11.9% | 10.5% |
| Interquartile 75% (IQ3) | 16.2% | 20.0% |
| Interquartile Range (IQR) | 4.3% | 9.5% |
| Standard Deviation (Sample) | 3.5% | 6.6% |
| Standard Deviation (Population) | 3.5% | 6.6% |
Similar Demographics by Cognitive Disability
Demographics Similar to Immigrants from Lithuania by Cognitive Disability
In terms of cognitive disability, the demographic groups most similar to Immigrants from Lithuania are Chinese (15.9%, a difference of 0.18%), Immigrants from India (15.9%, a difference of 0.27%), Immigrants from Hong Kong (16.0%, a difference of 0.41%), Thai (16.1%, a difference of 1.0%), and Immigrants from Ireland (16.1%, a difference of 1.1%).
| Demographics | Rating | Rank | Cognitive Disability |
| Immigrants | Taiwan | 100.0 /100 | #1 | Exceptional 15.7% |
| Immigrants | India | 100.0 /100 | #2 | Exceptional 15.9% |
| Chinese | 100.0 /100 | #3 | Exceptional 15.9% |
| Immigrants | Lithuania | 100.0 /100 | #4 | Exceptional 16.0% |
| Immigrants | Hong Kong | 100.0 /100 | #5 | Exceptional 16.0% |
| Thais | 100.0 /100 | #6 | Exceptional 16.1% |
| Immigrants | Ireland | 100.0 /100 | #7 | Exceptional 16.1% |
| Immigrants | Poland | 100.0 /100 | #8 | Exceptional 16.1% |
| Assyrians/Chaldeans/Syriacs | 100.0 /100 | #9 | Exceptional 16.2% |
| Immigrants | Scotland | 100.0 /100 | #10 | Exceptional 16.2% |
| Immigrants | Czechoslovakia | 100.0 /100 | #11 | Exceptional 16.2% |
| Maltese | 100.0 /100 | #12 | Exceptional 16.2% |
| Lithuanians | 100.0 /100 | #13 | Exceptional 16.3% |
| Immigrants | Austria | 100.0 /100 | #14 | Exceptional 16.3% |
| Immigrants | Greece | 100.0 /100 | #15 | Exceptional 16.3% |
Demographics Similar to Aleuts by Cognitive Disability
In terms of cognitive disability, the demographic groups most similar to Aleuts are French (17.0%, a difference of 0.0%), Chilean (17.0%, a difference of 0.0%), Carpatho Rusyn (17.0%, a difference of 0.020%), British (17.0%, a difference of 0.050%), and Immigrants from Brazil (17.0%, a difference of 0.050%).
| Demographics | Rating | Rank | Cognitive Disability |
| Immigrants | Chile | 91.7 /100 | #134 | Exceptional 17.0% |
| Lebanese | 91.3 /100 | #135 | Exceptional 17.0% |
| Israelis | 91.0 /100 | #136 | Exceptional 17.0% |
| Immigrants | Norway | 90.9 /100 | #137 | Exceptional 17.0% |
| Welsh | 90.8 /100 | #138 | Exceptional 17.0% |
| French | 90.0 /100 | #139 | Excellent 17.0% |
| Chileans | 89.9 /100 | #140 | Excellent 17.0% |
| Aleuts | 89.9 /100 | #141 | Excellent 17.0% |
| Carpatho Rusyns | 89.6 /100 | #142 | Excellent 17.0% |
| British | 89.3 /100 | #143 | Excellent 17.0% |
| Immigrants | Brazil | 89.3 /100 | #144 | Excellent 17.0% |
| Immigrants | South Eastern Asia | 88.7 /100 | #145 | Excellent 17.0% |
| Costa Ricans | 88.0 /100 | #146 | Excellent 17.0% |
| Scotch-Irish | 85.9 /100 | #147 | Excellent 17.1% |
| French Canadians | 85.7 /100 | #148 | Excellent 17.1% |