Danish vs Spanish American Disability
COMPARE
Danish
Spanish American
Disability
Disability Comparison
Danes
Spanish Americans
12.0%
DISABILITY
8.7/ 100
METRIC RATING
209th/ 347
METRIC RANK
13.6%
DISABILITY
0.0/ 100
METRIC RATING
312th/ 347
METRIC RANK
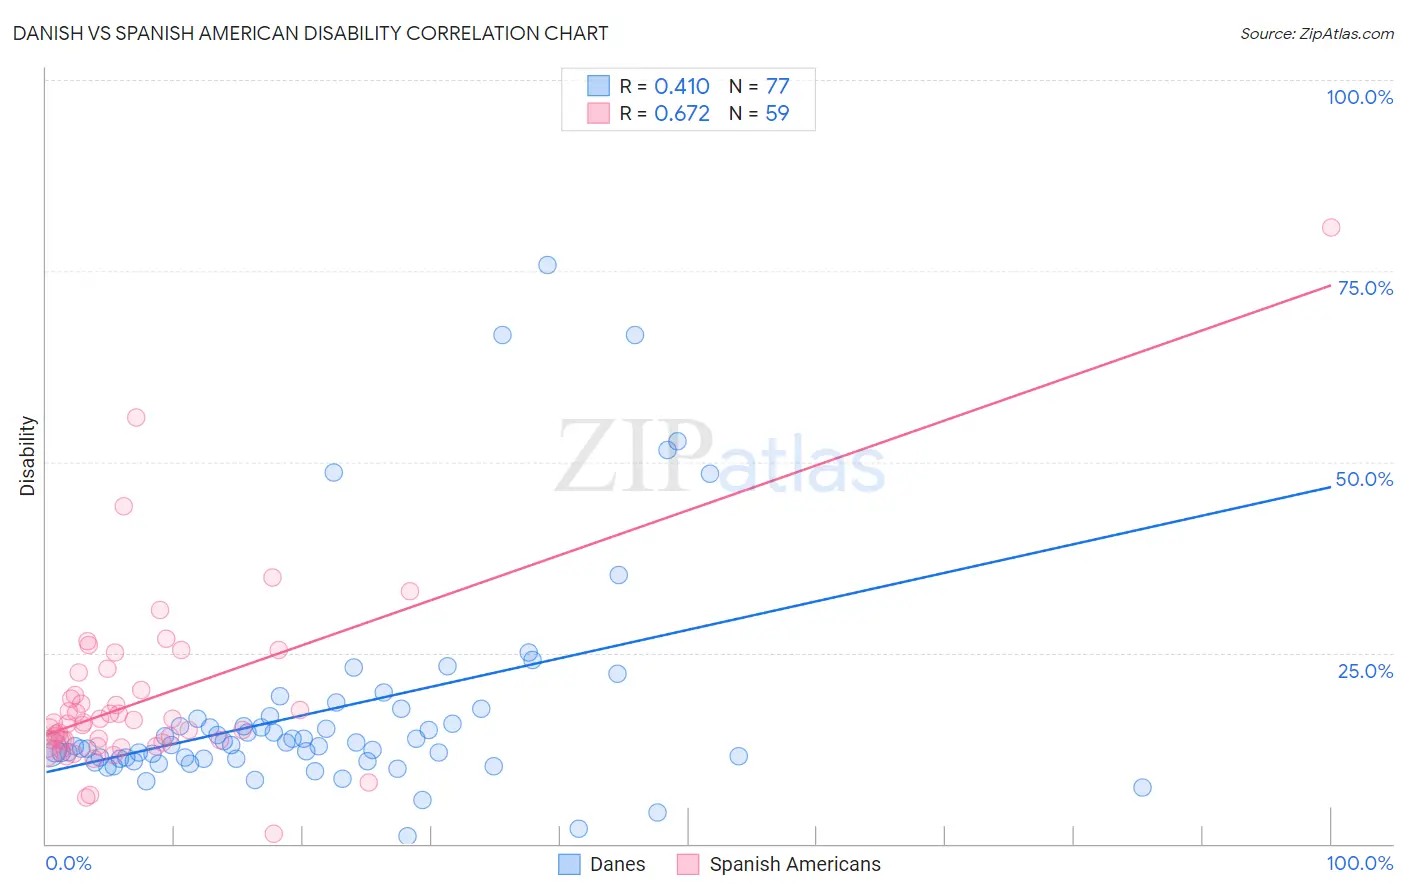
Danish vs Spanish American Disability Correlation Chart
The statistical analysis conducted on geographies consisting of 474,128,503 people shows a moderate positive correlation between the proportion of Danes and percentage of population with a disability in the United States with a correlation coefficient (R) of 0.410 and weighted average of 12.0%. Similarly, the statistical analysis conducted on geographies consisting of 103,168,597 people shows a significant positive correlation between the proportion of Spanish Americans and percentage of population with a disability in the United States with a correlation coefficient (R) of 0.672 and weighted average of 13.6%, a difference of 13.7%.
Disability Correlation Summary
| Measurement | Danish | Spanish American |
| Minimum | 0.97% | 1.3% |
| Maximum | 75.8% | 80.7% |
| Range | 74.8% | 79.5% |
| Mean | 17.5% | 18.8% |
| Median | 12.9% | 15.7% |
| Interquartile 25% (IQ1) | 11.1% | 13.3% |
| Interquartile 75% (IQ3) | 16.5% | 20.1% |
| Interquartile Range (IQR) | 5.4% | 6.8% |
| Standard Deviation (Sample) | 14.3% | 12.0% |
| Standard Deviation (Population) | 14.2% | 11.9% |
Similar Demographics by Disability
Demographics Similar to Danes by Disability
In terms of disability, the demographic groups most similar to Danes are Immigrants from Caribbean (12.0%, a difference of 0.050%), Immigrants from Thailand (12.0%, a difference of 0.070%), Immigrants from Senegal (12.0%, a difference of 0.080%), Czech (12.0%, a difference of 0.13%), and Immigrants from Western Europe (12.0%, a difference of 0.17%).
| Demographics | Rating | Rank | Disability |
| Immigrants | England | 12.0 /100 | #202 | Poor 12.0% |
| British West Indians | 11.5 /100 | #203 | Poor 12.0% |
| Mexican American Indians | 11.4 /100 | #204 | Poor 12.0% |
| Immigrants | Western Europe | 10.1 /100 | #205 | Poor 12.0% |
| Immigrants | Senegal | 9.4 /100 | #206 | Tragic 12.0% |
| Immigrants | Thailand | 9.3 /100 | #207 | Tragic 12.0% |
| Immigrants | Caribbean | 9.1 /100 | #208 | Tragic 12.0% |
| Danes | 8.7 /100 | #209 | Tragic 12.0% |
| Czechs | 7.9 /100 | #210 | Tragic 12.0% |
| Immigrants | Cambodia | 7.3 /100 | #211 | Tragic 12.0% |
| Austrians | 7.2 /100 | #212 | Tragic 12.0% |
| Immigrants | Iraq | 7.1 /100 | #213 | Tragic 12.0% |
| Immigrants | Somalia | 6.8 /100 | #214 | Tragic 12.0% |
| Immigrants | Canada | 6.1 /100 | #215 | Tragic 12.1% |
| Panamanians | 5.4 /100 | #216 | Tragic 12.1% |
Demographics Similar to Spanish Americans by Disability
In terms of disability, the demographic groups most similar to Spanish Americans are Delaware (13.6%, a difference of 0.24%), Blackfeet (13.6%, a difference of 0.28%), Cree (13.7%, a difference of 0.35%), Black/African American (13.7%, a difference of 0.39%), and Puget Sound Salish (13.7%, a difference of 0.39%).
| Demographics | Rating | Rank | Disability |
| French Canadians | 0.0 /100 | #305 | Tragic 13.4% |
| Cape Verdeans | 0.0 /100 | #306 | Tragic 13.5% |
| Shoshone | 0.0 /100 | #307 | Tragic 13.5% |
| French American Indians | 0.0 /100 | #308 | Tragic 13.5% |
| Tlingit-Haida | 0.0 /100 | #309 | Tragic 13.5% |
| Blackfeet | 0.0 /100 | #310 | Tragic 13.6% |
| Delaware | 0.0 /100 | #311 | Tragic 13.6% |
| Spanish Americans | 0.0 /100 | #312 | Tragic 13.6% |
| Cree | 0.0 /100 | #313 | Tragic 13.7% |
| Blacks/African Americans | 0.0 /100 | #314 | Tragic 13.7% |
| Puget Sound Salish | 0.0 /100 | #315 | Tragic 13.7% |
| Pima | 0.0 /100 | #316 | Tragic 13.7% |
| Immigrants | Cabo Verde | 0.0 /100 | #317 | Tragic 13.7% |
| Menominee | 0.0 /100 | #318 | Tragic 13.8% |
| Iroquois | 0.0 /100 | #319 | Tragic 13.8% |